


EURUSD, GBPUSD, USDRUB and USD index chart overview
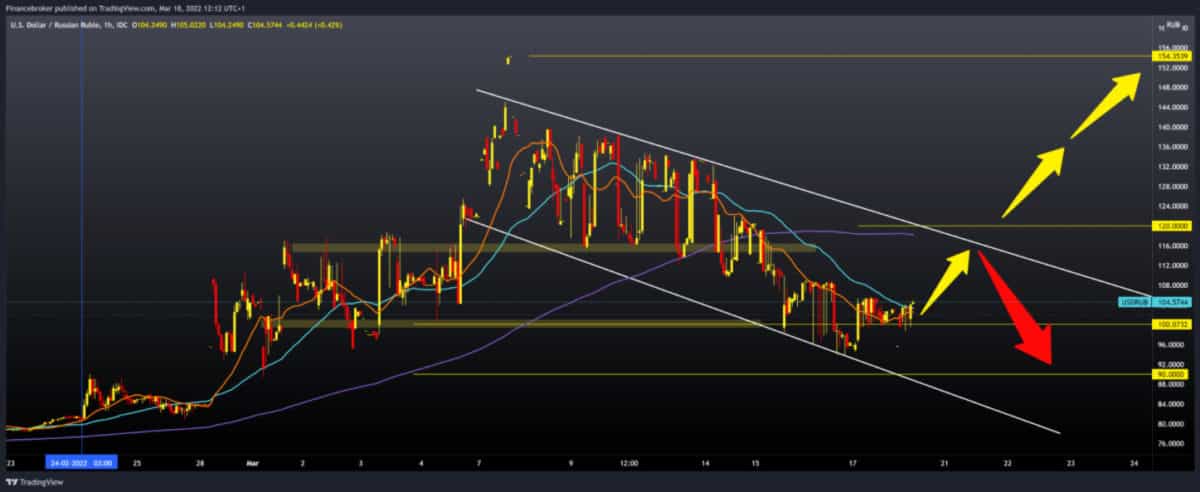
USDRUB chart analysis
The Russian ruble fell to its historic low of 154,350 last Monday. After that, we have the withdrawal or consolidation of the previous bullish impulse. Pair USDRUB fell to a two-week low of 94,000 yesterday and is in consolidation above 100,000 today. If from this consolidation, the pair climbs above 105,000, then we can expect to continue all the way to the upper trend line in the zone around 115,000-120,000. The moving averages of the MA20 and MA50 are on the bullish side, and the MA200 is waiting for us in the upper trend line. A break above 120,000 and MA200 could be a sign that we are continuing on the bullish side. We need a withdrawal below 100,000 levels for the bearish option, and then our first support is at 90,000. If the bearish pressure continues, then we can expect the return of the USDRUB in the period before the Ukrainian crisis.

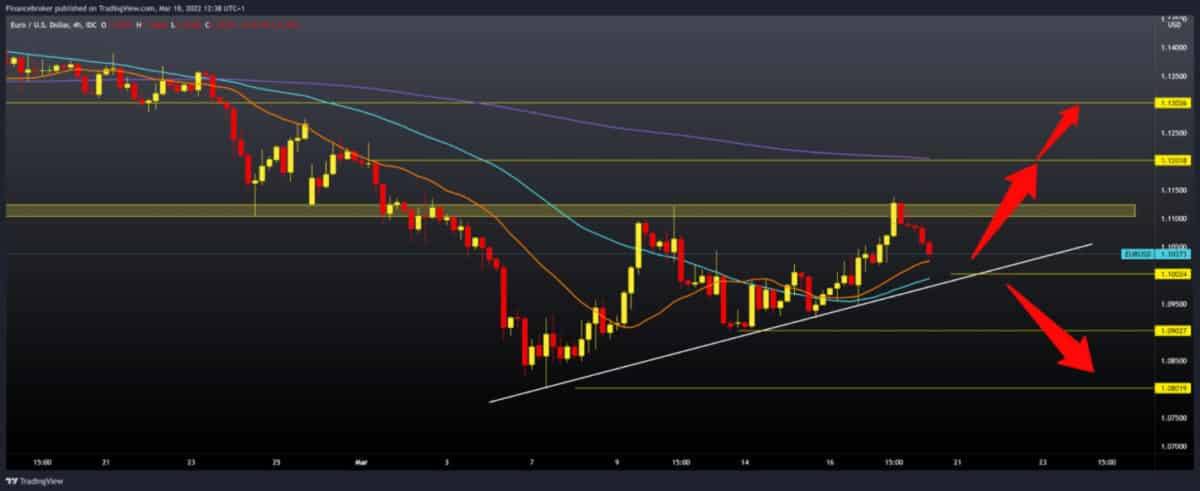
EURUSD chart analysis
Pair EURUSD once again encountered resistance in the zone around 1.11000, and now we have a new pullback to 1.10000. At 1,10000, the pair could get support in the MA20, MA50 moving averages and the bottom trend line. We can notice that the pair forms new higher lows on the chart, and if we happen to test the 1.11000 level again, there is a possibility to see a break above. If this happens, the next potential resistance is at 1.12000, with additional resistance in the MA200 moving average. The last time the pair was above the MA200 four-hour moving average was February 23. For the bearish option, we need a break below the moving average and a lower support line at 1.10000. If this scenario happens, we are looking for the next potential support at 1.09000, and if it does not last, we will go down to March low at 1.08000.

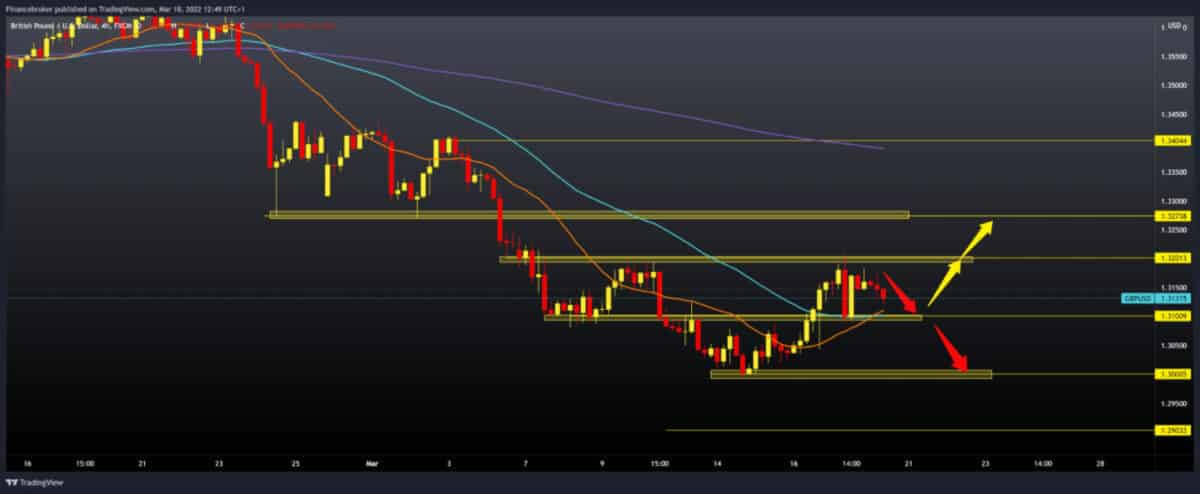
GBPUUSD chart analysis
Pair GBPUSD managed to climb to 1.32000 yesterday and test this level but made a new pullback after that, and we are now at 1.31300. We could find potential support at 1.31000 because MA20 and MA50 moving averages are waiting for us as additional support. If GBPUSD makes a new break above, it could form an inverted Head & Shoulders pattern on the chart. Then we would need a jump to 1.32750-1.33000, which would first confirm the break and then we need a retest to confirm the continued continuation of the bullish pound recovery. Then there would be a chance to see GBPUSD in the zone around 1.34000 and MA200 moving average by the end of the month. For the bearish option, we need a continuation of the current bearish trend and a retreat below 1.31000. If that happened, we would probably visit this year’s minimum in the zone around 1.30000.

Dollar index chart analysis
This week we saw the dollar withdraw from 99,400 to 97,725, and we can say that this was a turbulent week for the dollar index. Despite the increase in the interest rate from 0.25% to 0.50%, it did not give strength to the dollar in relation to other currencies. It probably takes longer for that market to absorb and apply. After the dollar fell to 97,725, it quickly picked up support and climbed to the current 98,447, and now we come to potential resistance to 98,500. MA20 and MA50 moving averages can create additional resistance at that level. A break above would give the dollar another chance to test the previous resistance zone and potentially climb to a psychological 100,000. For the bearish option, we need to withdraw from the current level or bounce off the upper resistance zone. It then re-tested support at 97.7250. If it doesn’t hold up, the dollar will slip to the next support in the zone of around 97,000 on the bottom trend line. Additional support at that level is in the MA200 moving average.

-
Support
-
Platform
-
Spread
-
Trading Instrument

