EURUSD, GBPUSD, NZDUSD dollar recovery reduces optimism
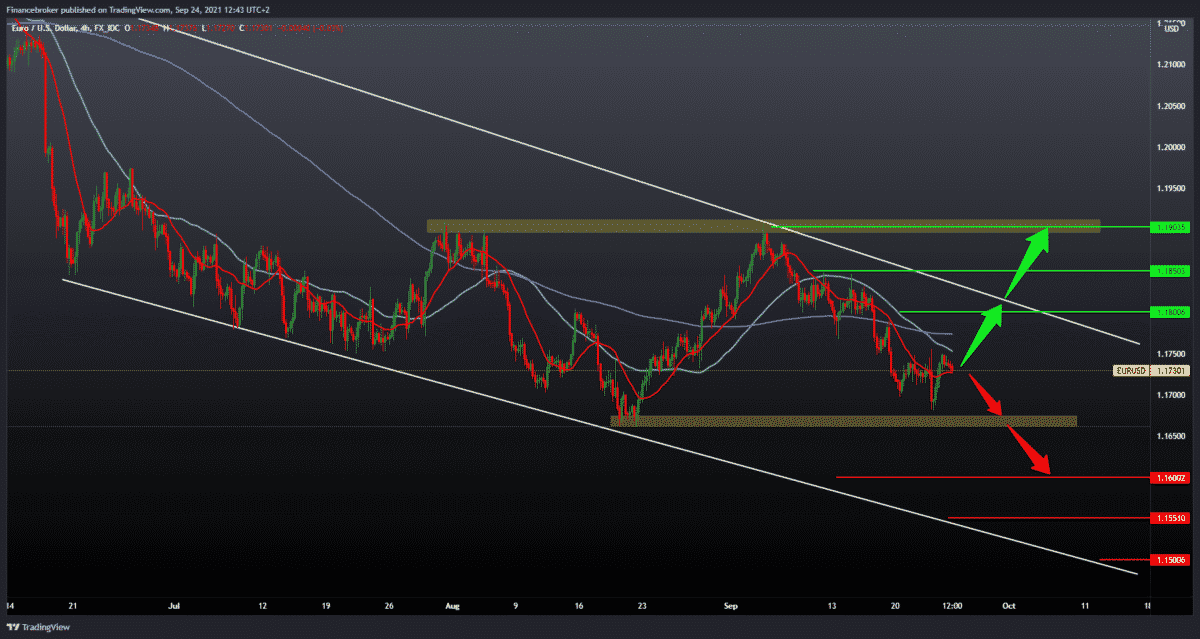
Looking at the EURUSD chart on the four-hour time frame, we see that the pair is still moving in the falling channel and by pressing the MA50 and MA200 moving averages. The EURUSD pair also made a new low yesterday at 1.16800 but failed to create a new lower low, falling below 1.16630 low from the second period of August. Break below this low leads us to new lower levels, and our first target is 1.16000. For the bullish scenario, we need better support on the chart, and for now, we have it in the MA20 moving average. Further positive consolidation may lead us to an upper line of resistance in the zone around 1.18000. The break above this resistance line leads us to the previous high at 1.19000, and the continuation above the door gives us optimism that we have turned back to the bullish trend.
GBPUSD chart analysis
Looking at the GBUPSD chart on the four-hour time frame, we see that we have resistance at the 38.2% Fibonacci level at 1.37470. We can first look for potential support at 23.6% Fibonacci level at 1,36900 with the additional backing for MA20 moving averages. If the pair does not gain support, there is a high probability that we will test the previous low again at 1.36100. For the bullish scenario, we need positive consolidation, which would raise the EURUSD pair above 50.0% Fibonacci levels, and then we would get additional support with the MA50 and MA200 moving average. We also see that the next higher resistance in the zone is around 61.8% Fibonacci level at 1.38380 and that we need a stronger bullish momentum that will be able to keep the pair above and move on to higher levels on the chart.
NZDUSD chart analysis
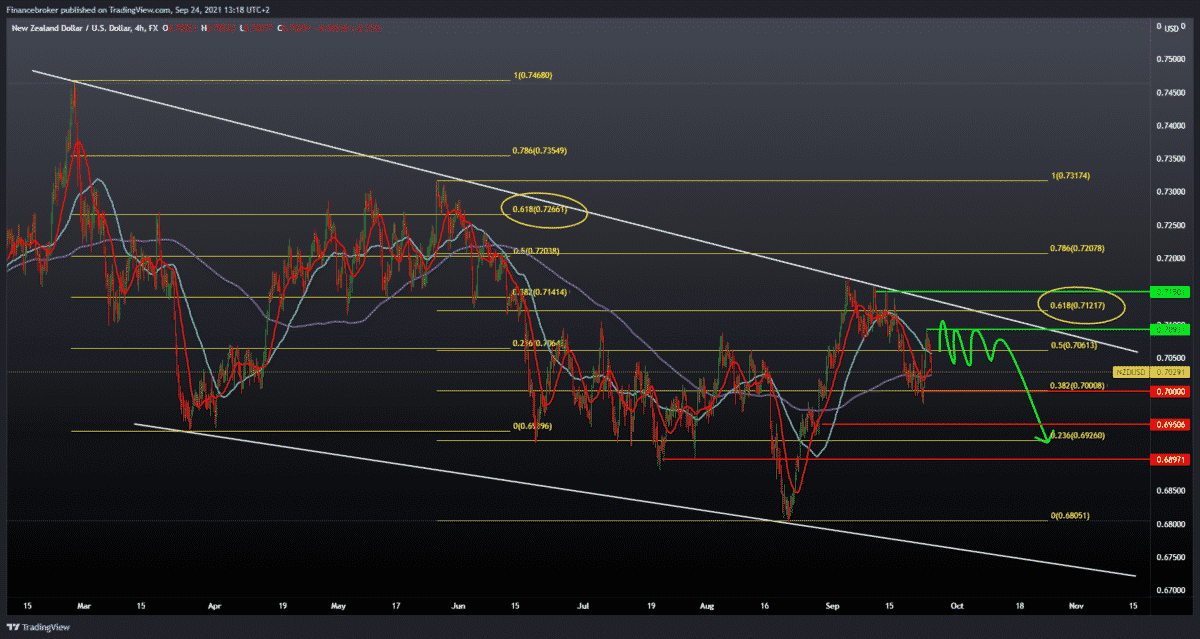
Looking at the NZDUSD chart on the daily time frame, we see that we are plowing in a descending channel and that the pair, after touching the top line of the channel, we have a further pull towards lower levels. By setting the Fibonacci level, we see that the resistance is at 61.8% Fibonacci level at 0.71220, and then we have support at 38.2% Fibonacci level at 0.7000. Now the pair is consolidating about 50.0% Fibonacci levels 0.70615 with some support for the MA200 moving average, which spends us moving into a bearish trend. Although more broadly, the pair is in a slightly bearish trend and based on that, a drop to the bottom line of support cannot be ruled out as a possible option. And what we can notice is that a larger support zone awaits us in the range of 0.69250 to 0.70000.
Market overview
German business confidence weakened for the third month in a row in September. As supply shortfalls lowered manufacturers’ expectations, the results of research by the Ifo Institute showed on Friday. The business climate index fell to 98.8 in September from 99.6 in August. The result was expected to fall to 98.9. Businesses were less satisfied with their current business, and they were also more skeptical about the coming months. The index of the current situation unexpectedly fell to 100.4 from 101.4 in the previous month, and the expected level was 101.8. Ifo President Clemens Fuest said that problems in the supply of raw materials and semi-finished products are hampering the German economy.
The third consecutive decline in IFO’s business confidence provides further evidence that Germany’s recovery is losing momentum as supply chain difficulties persist. The jump in gas prices puts additional pressure on prices and production, said Michael Tran, an economist at Capital Economics.