EURUSD, GBPUSD negative pressure at the beginning of the working week
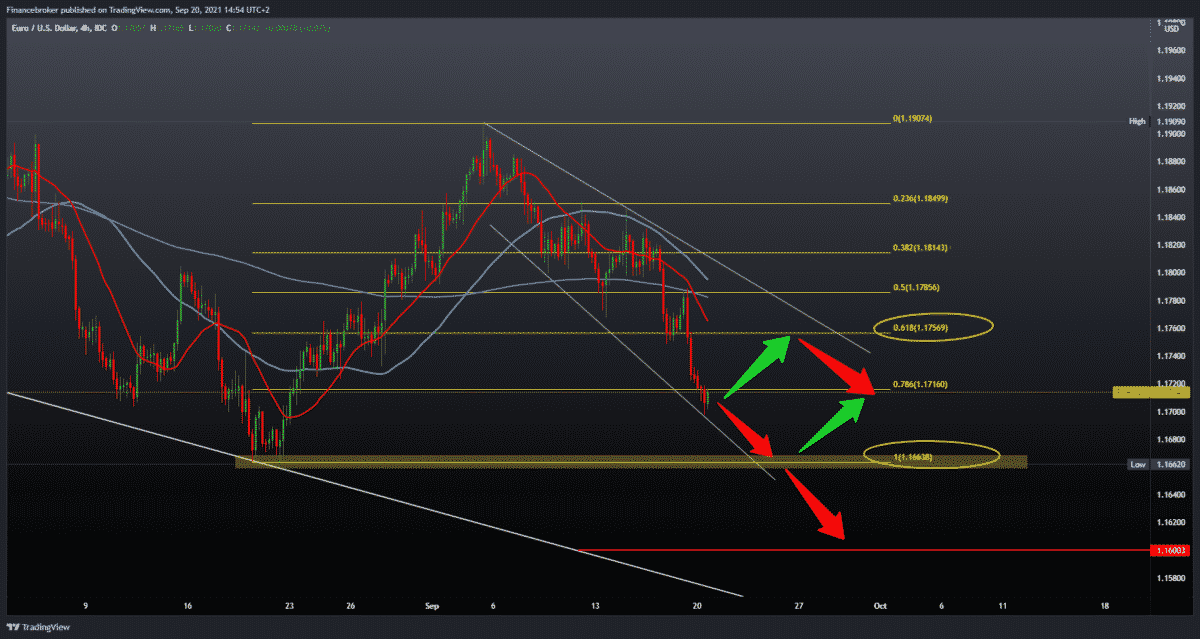
Looking at the four-hour time frame chart, we see that the EURUSD pair encountered resistance at 50.0% Fibonacci level at 1.17850 and MA200 moving average. After that, we have a drag towards the lower levels on the chart. The pair broke 61.8% Fibonacci level and 78.6% Fibonacci level at 1.17160. We currently have little support at the current level, and we can expect a shorter recovery towards the top of the break at a 61.8% level. If EURUSD manages to continue above this level, our next resistance is moving averages in the area of 1.17500-1.18000. Only a break above this resistance zone can direct us to the further continuation to the bullish side. We expect further negative consolidation for the bearish sequel, which may bring us down to support at the previous low at 1.16200.
GBPUSD chart analysis
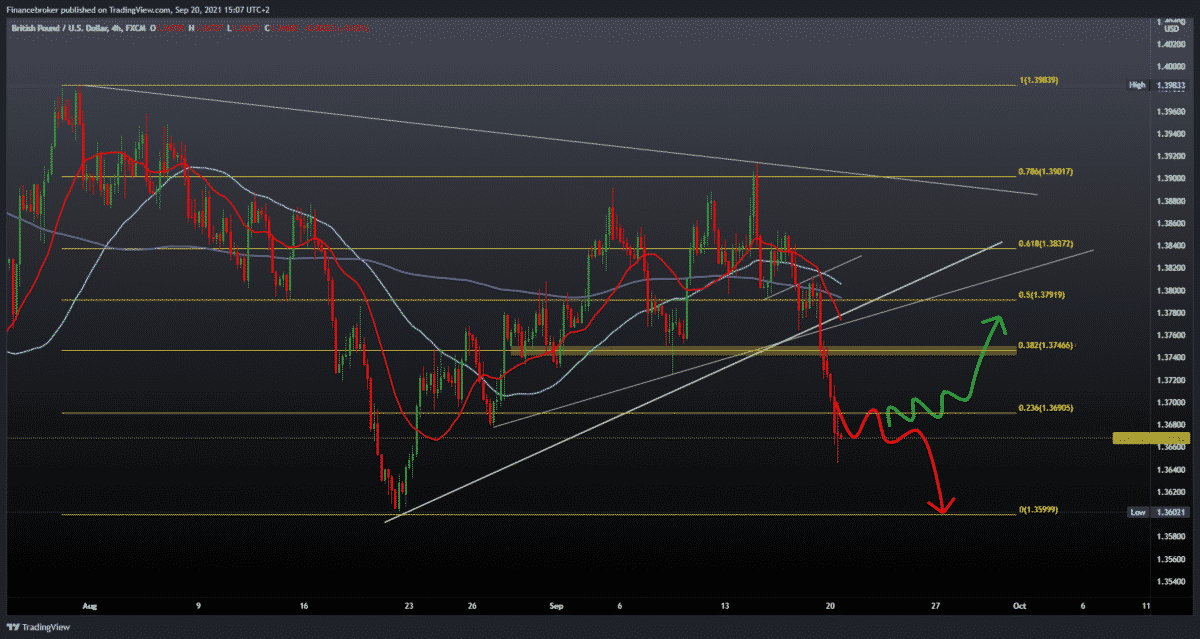
Looking at the chart on the four-hour time frame, we see that the pair is under a lot of pressure, dropping from last week’s 1.39000 to today’s 1.36720. If the pair continues on the bearish side, we look for the first support in the zone of the previous low at 1.36000. The dollar continued to rise, continuing a positive series of gains from last Friday. We first need a positive consolidation for the bullish trend that will reverse the current situation and direct the pair towards higher levels on the chart.
Market overview
EU ministers will discuss how to ease tensions with London over trade between Great Britain and Northern Ireland at a meeting on Tuesday, but the bloc will not renegotiate the provisions for the sensitive border agreed in the Brexit divorce agreement, a senior EU diplomat said on Monday. The EU executive, negotiating with London on behalf of the bloc’s 27 member states, is expected to present plans to facilitate the movement of goods after Brexit by the end of September. The average price of real estate coming to the housing market in the UK reached a new all-time high in September despite a traditional summer holiday, data from the Rightmove real estate website showed on Monday. The average asking price was 338,462 GBP. Still, Rightmove said this new record was only £ 15 higher than the previous record set in July, a sign that prices are now stabilizing. Fierce competition among buyers for a small record number of available properties for sale continued. However, there were early signs that more real estate would hit the market, which could help slowly rebuild buyers’ choices. House prices rose 5.8 percent year-on-year in September, after increasing 5.6 percent in August. On a monthly basis, house prices rose 0.3 percent, offsetting a 0.3 percent drop in the previous month. German producer prices rose in August at the fastest pace since 1974, Destatis data revealed on Monday. Producer price inflation raised to 12 percent in August from 10.4 percent in July. That was the largest increase since December 1974, when prices rose by 12.4 percent in the middle of the first oil crisis. On a monthly data, producer prices advanced 1.5 percent, but slower than the growth of 1.9 percent in July. Excluding energy, producer prices rose 8.3 percent. The annual growth was largely due to a 24 percent increase in energy prices. Prices of intermediate products rose by 17.1 percent. At the same time, the prices of durable consumer goods rose by 2.8 percent and the prices of capital goods by 2.4 percent. Prices of non-durable consumer goods rose 2.1 percent.