EURUSD, GBPUSD, GBPAUD overview at the beginning of the week
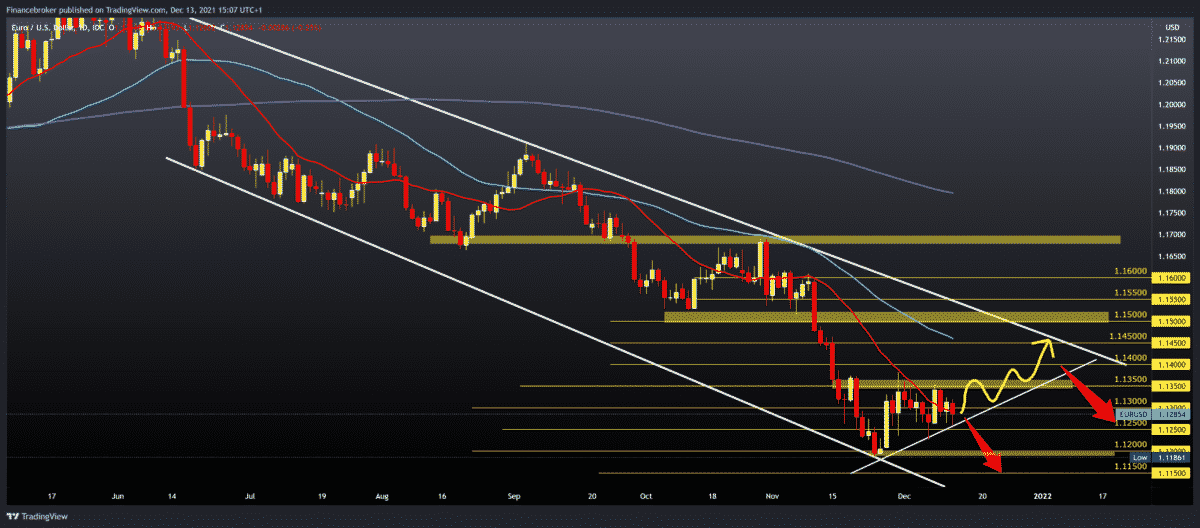
Looking at the EURUSD pair on the daily chart, we see it is in consolidation after support at 1.11861. We can draw the current trend line below, which is our potential support for further recovery of the pair. A significant obstacle for such a thing is the resistance zone at 1.13500, and if we manage to make a break above then, we can expect further recovery. Bullish scenario:
We need continued positive consolidation and new resistance testing at 1.13000.
The break above climbs us to 1.14000, then 1.14500, where resistance in the MA50 moving average awaits us.
Our current target is the upper trend line about the zone around 1.15000.
Bearish scenario:
We need continued negative consolidation and pressure on the lower trend line.
Break below the trend line brings us to support testing at 1.12500.
Further lowering of EURUSD directs us towards the previous minimum this year at 1.11800.
GBPUSD chart analysis
Looking at GBPUSD on the daily chart, we see that the pair found support at 1.31600. After positive consolidation, the pair moved to 1.32620, making a shorter bullish shift. We now hope to continue bullish consolidation within this large falling channel on the chart. Bullish scenario:
We need continued positive consolidation to 1.33210 23.6% Fibonacci levels.
At the same level, the additional resistance is the MA20 moving average.
The break above directs us further towards the next resistance at 38.2% Fibonacci level at 1.34200.
We have the next resistance at the 50.0% Fibonacci level at 1.35000; we have an MA50 moving average as additional resistance.
Bearish scenario:
We need a new negative consolidation and targeting of GBPUSD towards 1.32000.
A further decline brings us down to 1.31600 this year’s low, and if bearish pressure continues, we can expect a further drop towards new lows.
GBPAUD chart analysis
Looking at the daily time frame chart, we see that GBPAUD found support on the MA200 moving average at 1.84000. This year’s trend is bullish, and we can expect it below. Bullish scenario:
We need the continuation of positive consolidation, and with the support of other moving averages, we expect the continuation of the bullish impulse.
Our first resistance and target are 1.89000 last week’s high. Bearish scenario:
We need to continue the negative consolidation and withdraw to the MA200 moving average at 1.84000.
Our next lower support is the lower trend line in the 1.82000 zones.