EURUSD, GBPUSD, AUDUSD Looking at Potential Support
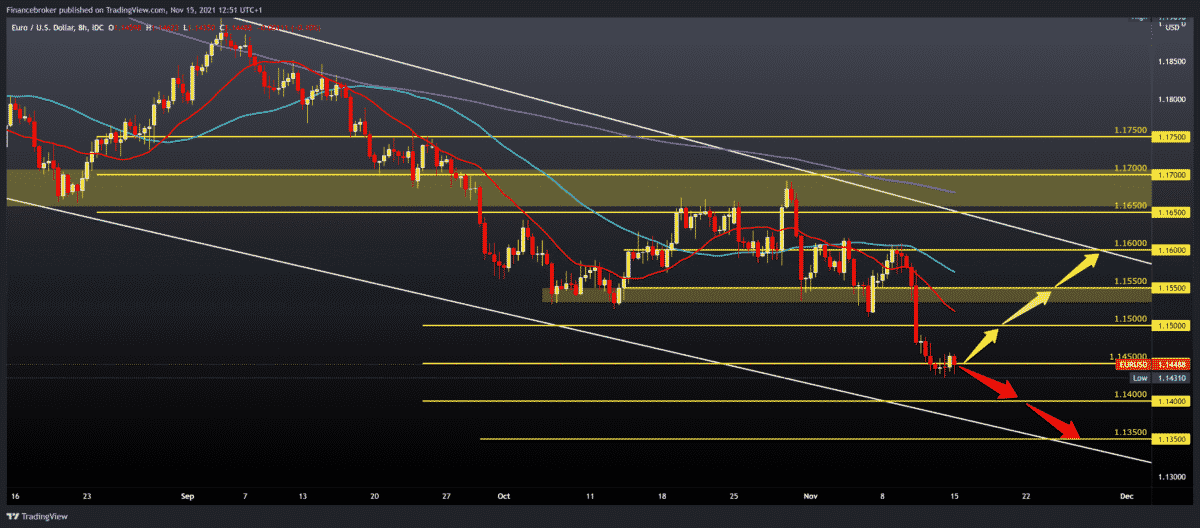
The latest week’s pair EURUSD made a break below the psychological support zone at 1.15000. The pair hit a new lower low this year at 1.14310. The week began with continued consolidation in that zone of potential support. The picture is still very bearish, but there are indications that there may be a slight recovery on the chart.
Bullish scenario:
- We need better support at the current level of 1.14500, and positive consolidation could climb the price to 1.15000.
- A break above 1.15000 brings us closer to a larger resistance zone around the 1.15500 October support zone.
- Above, we come across MA20 and MA50 moving averages and seek their support for further continuation on the bullish side.
- Our next target and resistance is on the 16000 upper trend line.
Bearish scenario:
- Negative consolidation pushes us lower below this year’s lower low to 1.14310.
- The breakthrough below led us to a new this year low.
- The first lower support is on 1.14000, then to 1.13500 on the bottom trend line.

GBPUSD chart analysis
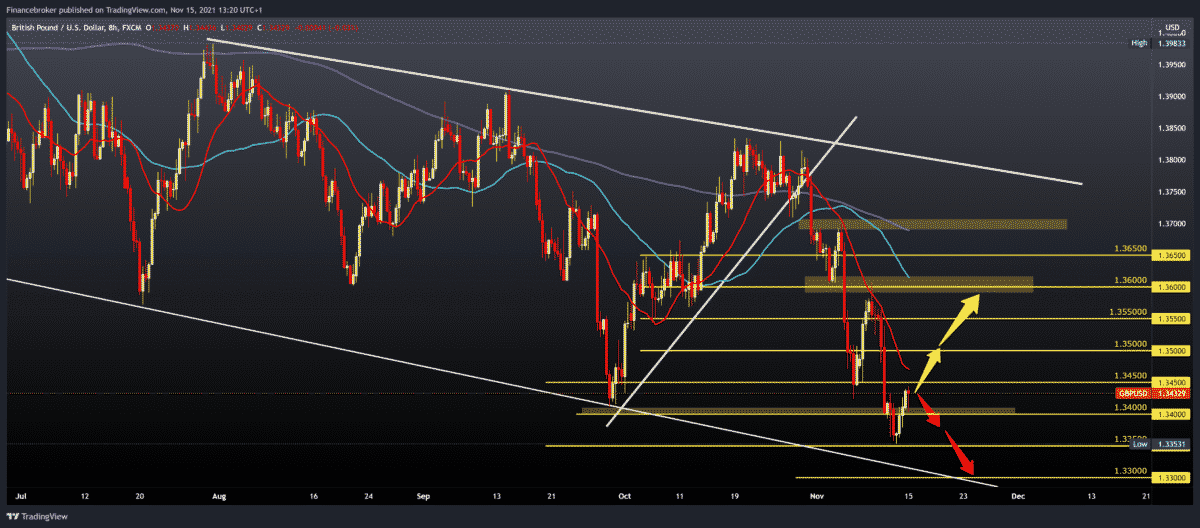
Last Friday, the pair made a new lower this year to 1.33531. The pound lasted, and the pair broke the previous October low to 1.34100. Today GBPUSD is in a positive shift from the previous low, and we are now at 1.34340. We need to break above the MA20 moving average for further growth to get better support on the chart.
Bullish scenario:
- For further continuation, we need a break above 1.35000 and the MA20 moving average.
- Then our next target is 1.35000 psychological level.
- A break above can lead us towards the previous high at 1.36000, the place of resistance that sent us down to current levels.
Bearish scenario:
- To continue on the bearish side, we can expect resistance at 1.34500.
- Further negative consolidation brings us down to 1.34000 and then to 1.33500, the previous lower low, and the break below us brings us to a new low this year.
- As potential support on the chart, we have the bottom trend line.

AUDUSD chart analysis
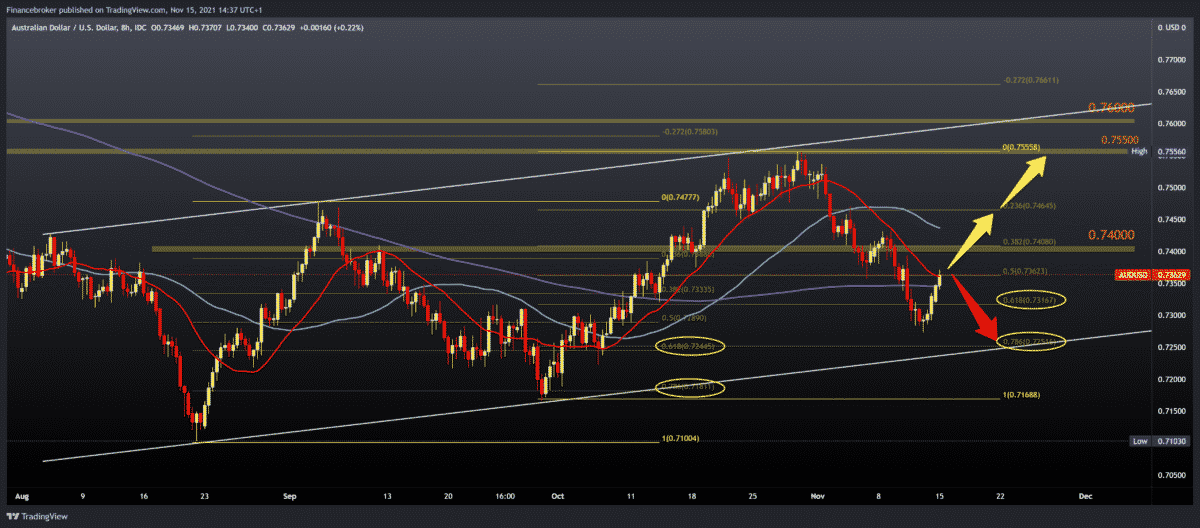
On Friday, the pair found support at 0.72730, after which it climbed to 0.73650 today. Since August, we are in a growing channel. What we can notice is the rejection of the Fibonacci level. We see that the pair finds support in the 61.8-78.6% Fibonacci level zone, and after that, we will have to grow on the chart again. Based on this movement, we can expect the further bullish movement to the upper line of the channel.
Bullish scenario:
- We need further positive consolidation with the support of MA20 and MA200 moving averages.
- Our next bullish target is the 38.2% Fibonacci level at 0.74000.
- The break above us leads to the next resistance of the MA50 moving average at 0.74500, and the next resistance is at 0.74650 at a 23.6% Fibonacci level.
- The maximum target on this time frame is our upper channel line in the zone 0.75500 -0.76000.
Bearish scenario:
- First, we need a pull below the MA20 and MA200 moving averages and 50.0% Fibonacci levels.
- A further decline AUDUSD seeks support at 61.8% Fibonacci level at 0.73170.
- Our next lower support is at 78.6% Fibonacci level at 0.72515 on the channel’s bottom line.

Market overview
The current tightening of monetary policy to curb inflation could stifle the eurozone’s recovery, European Central Bank President Christine Lagarde said on Monday, rejecting calls and market bets for tighter policies.
With inflation already at twice the 2% target and likely to rise further later this year, the ECB is under increasing pressure to abandon its ultra-light monetary policy and tackle rising prices that undermine household purchasing power.
Addressing EU lawmakers, Lagarde acknowledged that the jump in inflation would be bigger and longer than previously thought. But she said it would fade next year, so policy measures would now hit the economy just as price growth begins to slow on its own.
If we were to take any tightening measures now, she said it could do much more harm than it would bring any benefit.
With rising commodity prices and bottlenecks in the supply chain, inflation is faster to implement than previously predicted.
-
Support
-
Platform
-
Spread
-
Trading Instrument


