

EURUSD, GBPUSD and USDRUB at the start of the week
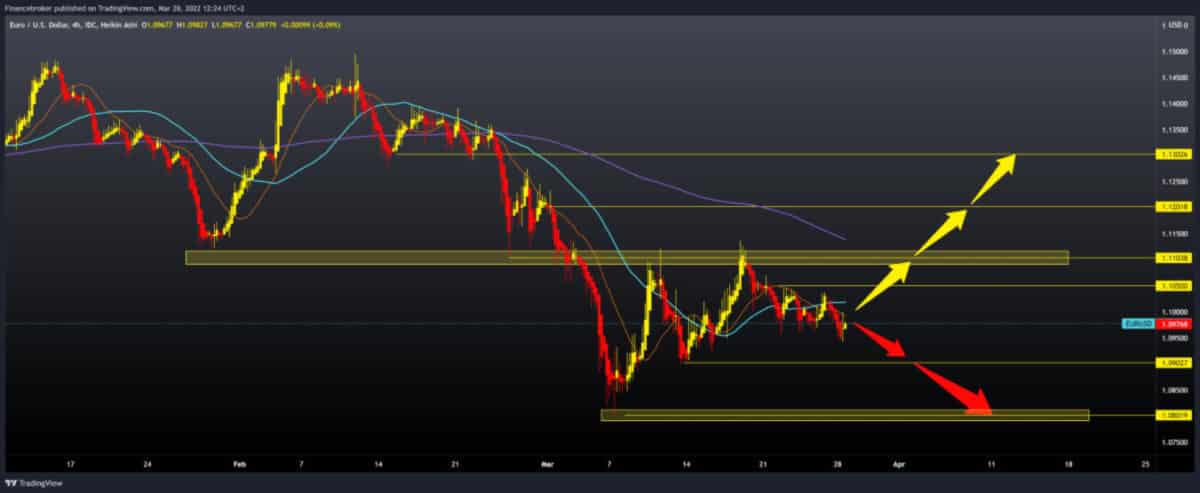
EURUSD chart analysis
During the Asian session, the euro weakened against the dollar. Yields on ten-year U.S. bonds reached 2.5%. The conflict in Ukraine and the application of harsh sanctions against Russia bring different consequences for the economies of the United States and Europe. They are extremely difficult for Europe. The European Central Bank recognizes this and does not intend to raise the reference interest rate in the foreseeable future. The euro is exchanged for 1.09750 dollars, weakening the common European currency by 0.02% since the beginning of trading tonight. At the start of the European session, the EURUSD pair found support at 1.09500, and we are now seeing a slight recovery. We are still testing the 1,10000 level, and we need a break above 1.10500 to reduce better support. The MA20 and MA50 moving averages then provide additional support. Our next potential resistance is at 1.11000, with resistance in the MA200 moving average. For the bearish option, we need a continuation of the negative consolidation and a retreat towards 1.09000. And if this support does not last, we will look for the next support at this year’s minimum of 1.08000.
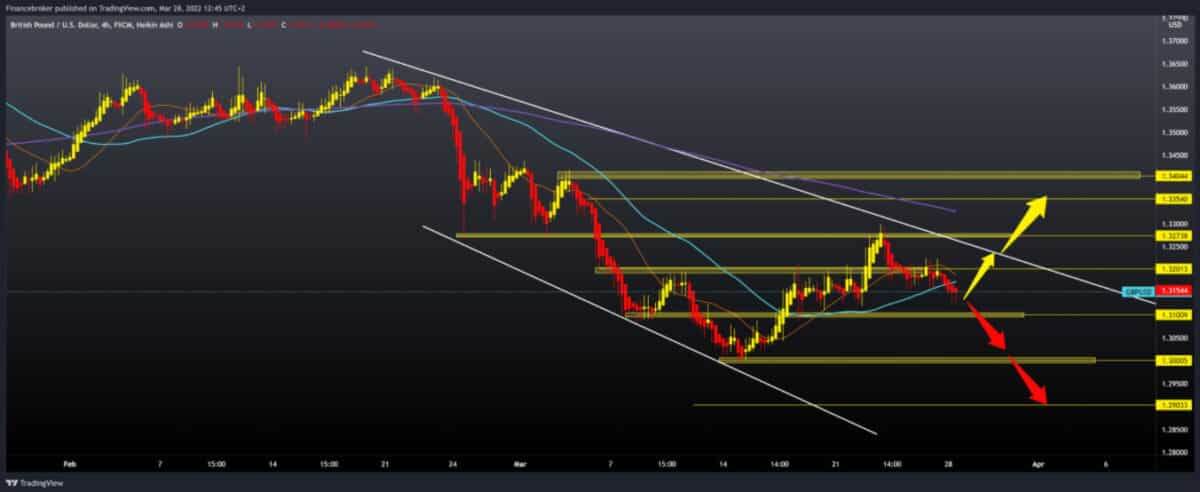
GBPUSD chart analysis
During the Asian session, the British pound weakened against the US dollar. Rapid inflation and the tense geopolitical situation in the world in the UK are threatening the economic growth of the British economy, as the Bank of England emphasized in its official statement earlier this month. The pound is exchanged for $ 1.31530, which is weakening the British currency by 0.20% since the beginning of trading tonight. Our current resistance is at 1.32000, and the pair has fallen below the MA20 and MA50 moving averages, which signals that the bearish pressure is increasing. We are entering last week’s consolidation zone in the range of 1.31000-1.32000. If the bearish pressure continues, we will probably see a break below the 1.31000 support zone, and the next potential support is then sought at the 1.30000 psychological level and this year’s minimum. We need a break above the upper resistance line and 1.33000 levels for a potential bullish trend. Additional resistance to that level is in the MA200 moving average. And further positive consolidation can take us to the next zone of the March maximum at 1.33500-1.34000.

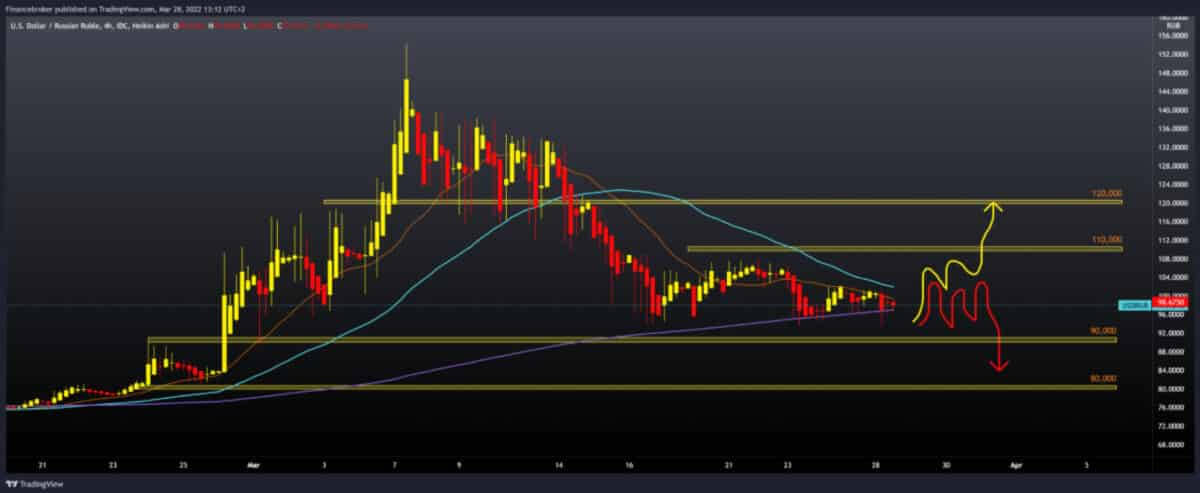
USDRUB chart analysis
The USDRUB pair continues its consolidation in the range between 90,000 and 100,000. We are literally sitting on the MA200 moving average and looking to see if we will see a break below or a bullish momentum that would launch this pair above 110,000. Even moving averages collect around 100,000 levels. We need positive consolidation above 105,000 and above moving averages for the bullish option. This would certainly boost bullish optimism and give an incentive to continue towards the previous high. Otherwise, we need a negative consolidation for the bearish option that will break below MA200 and lower us to a zone of around 90,000. After that, we can expect increased bearish pressure and a further weakening of the dollar against the Russian ruble.

Market overview
The Bank of Japan offered to buy an unlimited amount of 10-year Japanese government bonds after yields rose to the upper limit of the target range.
In a statement issued Monday, the central bank said it would buy an unlimited number of ten-year JGBs at 0.25 % for three days in a row starting March 29.
Earlier, on February 14, the central bank conducted unlimited purchases of JGB at 0.25 %.
Despite the intervention, government bond yields continued to rise relative to the US Federal Reserve’s hawk stance.
-
Support
-
Platform
-
Spread
-
Trading Instrument

