


EURUSD and AUDUSD possible smaller recovery
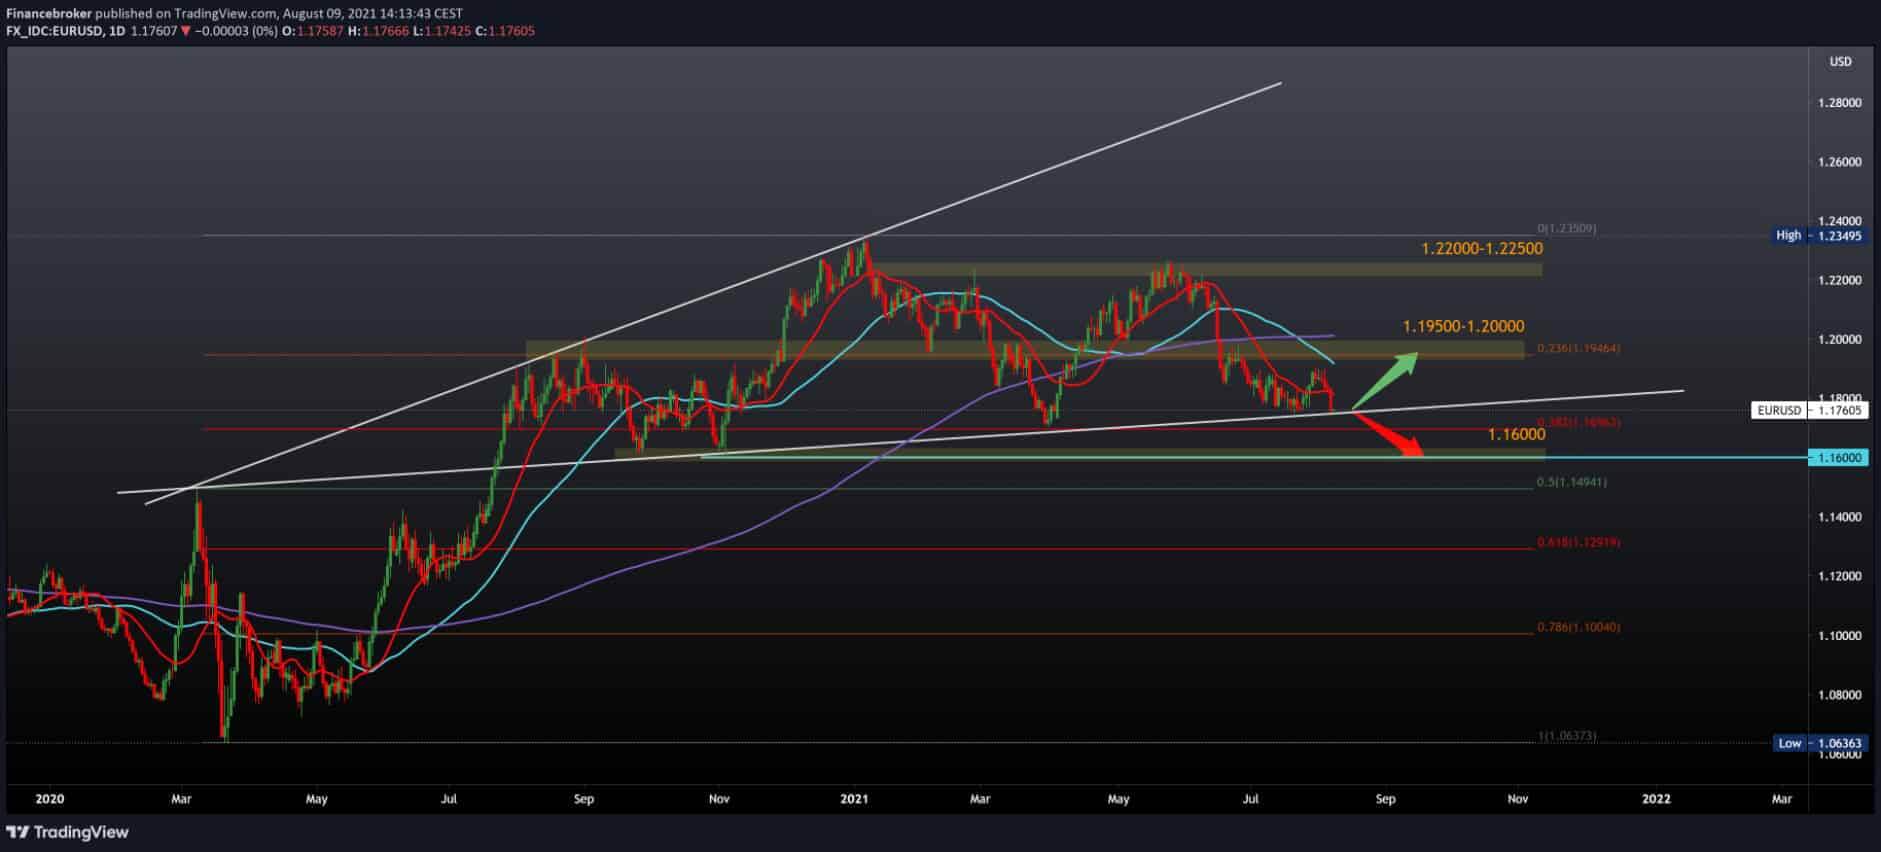
EURUSD chart analysis
Looking at the chart on the daily time frame, we see that the pair is still on a very important trend line, whose break can bring us down to 1.16000. For now, the trend line is performing solid support and less upward tracking following the 20-day moving average to 1.18250. Looking at the Fibonacci level up, our resistance at 23.6% is 1.19460, which coincides with the 50-day moving average, while the 200-day moving average is in the zone of around 1.20000. With the fall of EURUSD below the bottom line, we are looking for the first support in the 38.2% Fibonacci level, a zone that lasted in April, and for the last week, pressure is increased in the same place.

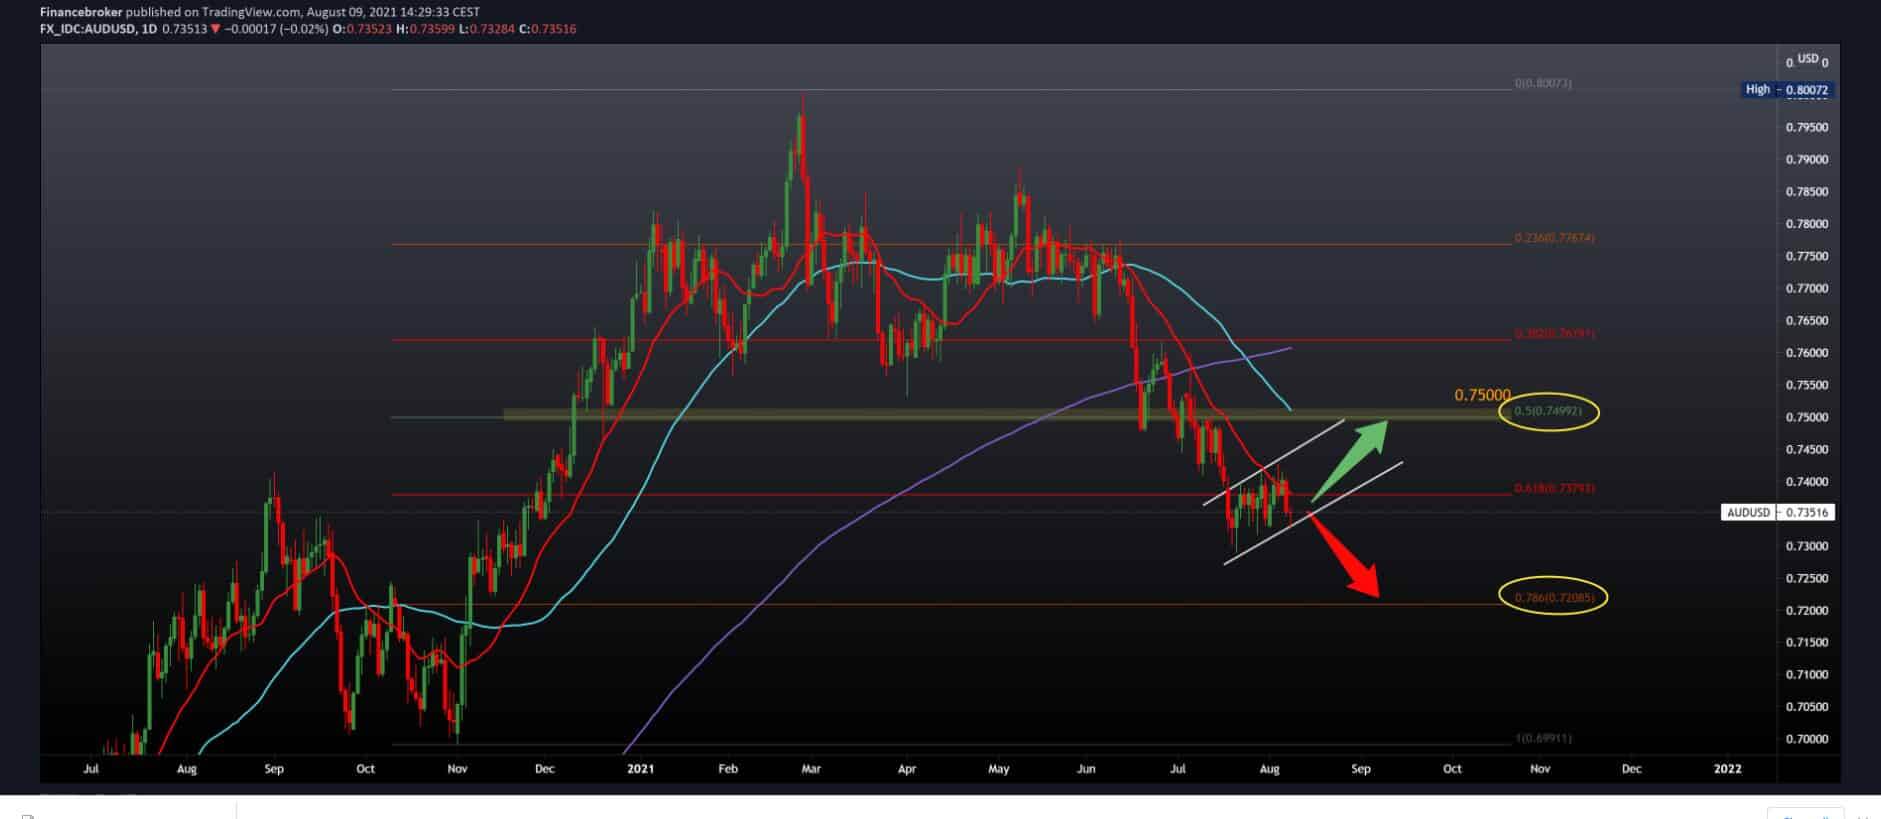
AUDUSD chart analysis
Looking at the graph on the daily time frame, we see that the pair has been consolidating about 61.8% of Fibonacci levels at 0.75000 for 15 days. For now, this consolidation is climbing slightly, not making a new lower low, and in the next week, we can expect the continuation of this consolidation. As of March on this chart, we are in a bearish trend with 0.80000to the current 0.73475. If we look at moving averages and expect AUDUSD recovery and growth, we need a break above the 20-day moving average first, which then steers us towards a 50-day moving average at 50.0% Fibonacci level at 0.75000. For the bearish scenario, we expect a break below the smaller line of this consolidation and a break below the previous low at 0.72900, with the view that the pair will drop to 78.6% Fibonacci levels.

Market overview
The combination of factors failed to help the AUD / USD pair capitalize on its modest intraday rebound from the region of 0.7330-25, or more than the weekly lows reached earlier this Monday. The COVID-19 fear overshadowed stronger Chinese inflation and did nothing that significantly boosted the Australian dollar. In addition to this, the bullish feeling surrounding the U.S. dollar further prevented traders from placing any bullish bets on other currencies from the main basket.
The U.S. Monthly Employment Report has sparked speculation that the Fed could start cutting asset purchases later this year. Investors also appear to have begun pricing in the possibility of higher interest rates as soon as 2022, which intensified the extension of a positive step in U.S. Treasury yield bonds. In fact, the yield on the reference ten-year U.S. government bond exceeded the 1.30% threshold, which, in turn, continued to act as a wind in the back for the USD.
Eurozone investor morale fell to a three-month low in August due to a sharp drop in expectations due to concerns that new quarantine restrictions could appear in the fall, but also later, the research showed on Monday.
Sentik’s index for the eurozone fell to 22.2 points in August from 29.8 in July. The expectations sub-index suffered its third drop in a row and fell to its lowest level since May 2020. The current conditions index rose for the sixth month in a row, reaching its highest level since October 2018.
“The eurozone economy is growing, but the pace is slowing significantly,” said Sentika CEO Patrick Hussi.
German export growth accelerated in June despite headlines in the supply chain, while import growth slowed compared to May, official Destatis data showed on Monday.
Exports rose 1.3 percent per month in June, after a revised increase of 0.4 percent the previous month. The rate was expected to rise 0.4 percent after 0.3 percent growth, which was originally estimated for May.
Meanwhile, import growth dropped significantly to 0.6 percent from 3.4 percent. Economists predicted that monthly growth would slow to 0.5 percent.
-
Support
-
Platform
-
Spread
-
Trading Instrument

