


EURUSD and AUDUSD daily chart view for August 12, 2021.
EURUSD chart analysis
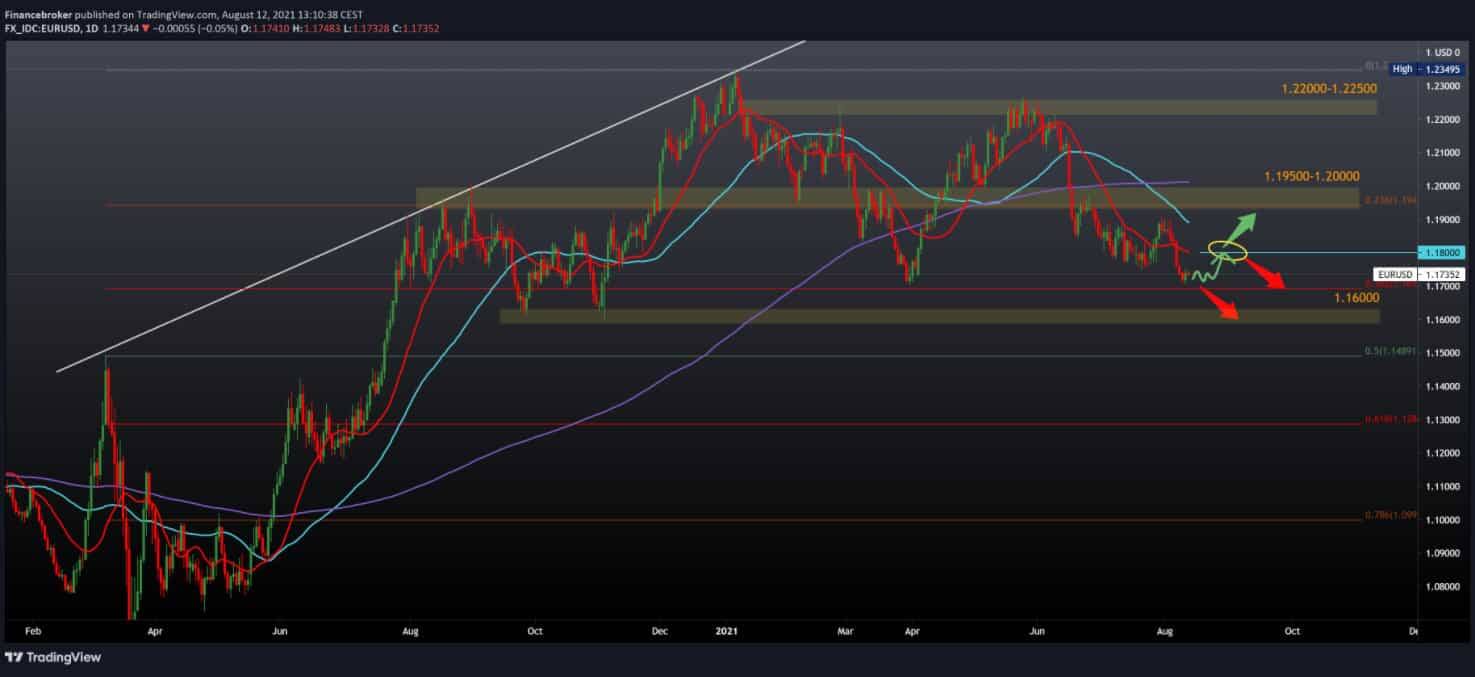
Looking at the EURUSD chart on the daily time frame, we see that the Euro has stalled in its quest to climb to 1.18000 and test the 20-day moving average. We are currently at 1.17300-1.17400, where the pair is consolidating. We are still close to 38.2% Fibonacci level at 1.16950, which gives us instant support because we have already seen once that this zone has endured and sent a couple up to higher levels. For the bullish scenario, we definitely need a break above the 20-day moving average in order to have a more concrete indicator on the chart that the pair will continue towards the 23.6% Fibonacci level at 1.19500. For the bearish scenario, we expect the pair to continue to descend to a new test of 38.2% Fibonacci level break below, directing us towards 1.16000. What is still likely is that we will see before that a smaller pullback to the zone of 20 daily and 50 daily moving average in the area 1.18000-1.19000. After that, the continuation falls, but then we can also see a larger correction below 1.16000.

AUDUSD chart analysis
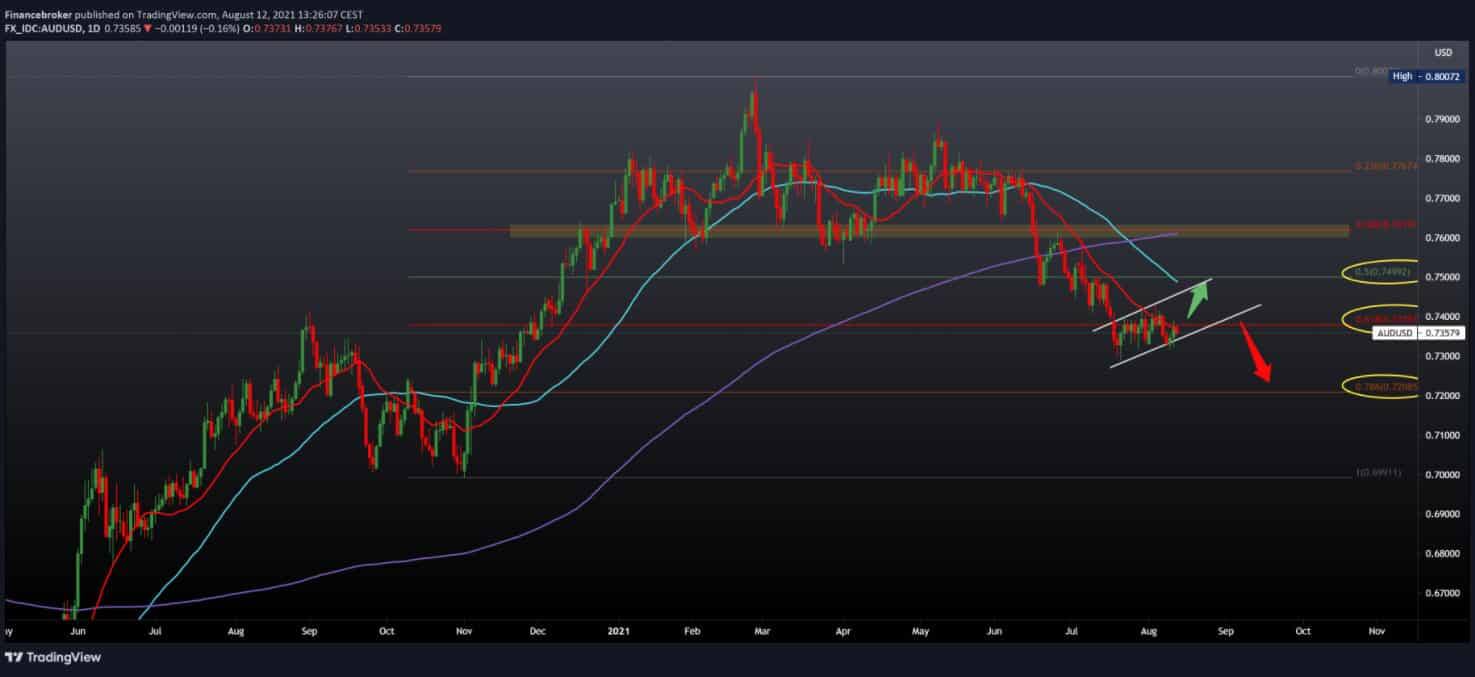
Looking at AUDUSD on the daily time frame, we see that the pair is still consolidating around 61.8% Fibonacci levels at 0.73800. The day AUD started negatively, and the pair failed to break above 0.74000 yesterday, we are currently at 0.73500 with a tendency to go down even lower by testing the 0.73000 level. Looking at moving averages, the pair tested a 20-day moving average. For the bullish scenario, we need a break above MA20 and a stronger momentum above 0.74000 in order to head towards the 50 day moving average in the zone around 0.75000 at a 50.0% Fibonacci level. We expect the MA20 to be sufficient resistance for the bearish scenario and bounce the price towards lower levels on the chart. Our first target is the previous low at 0.72888, and if AUD continues to be weak, we can drop from 0.72000 to 78.6% Fibonacci level.

Market overview
Industrial production in the eurozone fell slightly in June, data released by Eurostat showed on Thursday.
Industrial production fell 0.3 percent on a monthly basis, down from 1.1 percent in May. This was the second consecutive drop. Economists predicted a monthly decline of 0.2 percent.
The decline was caused by a 1.5 percent drop in capital goods production and a 0.6 percent drop in energy production. Meanwhile, the production of consumer durables rose 1.6 percent. Production of durable consumer goods and raw materials increased by 0.1 percent each.
On an annual basis, industrial production growth fell to 9.7 percent in June from 20.6 percent in May. Production was expected to climb 10.4 percent.
Industrial production in the EU27 fell 0.2 percent in June but rose 10.5 percent from the same period last year.
In August, consumer confidence in Australia weakened as the spread of the coronavirus situation locally strained expectations, data from a Westpac survey showed on Wednesday.
The Westpac-Melbourne Institute’s consumer sentiment index fell 4.4 percent to 104.1 in August from 108.8 in July. This was the lowest point of the year, but it remained in positive territory, even in the parts of the country facing the biggest challenges of the virus.
The availability of effective vaccines against COVID is a key source of trust support.
Matthew Hassan, a senior economist at Westpac, said that the central case remains that widespread vaccination will reopen for recovery by the November meeting of the Board, which means that this will still be the right time for the Reserve Bank to start reducing its bond purchases.
-
Support
-
Platform
-
Spread
-
Trading Instrument

