EUR/JPY forecast for January 6
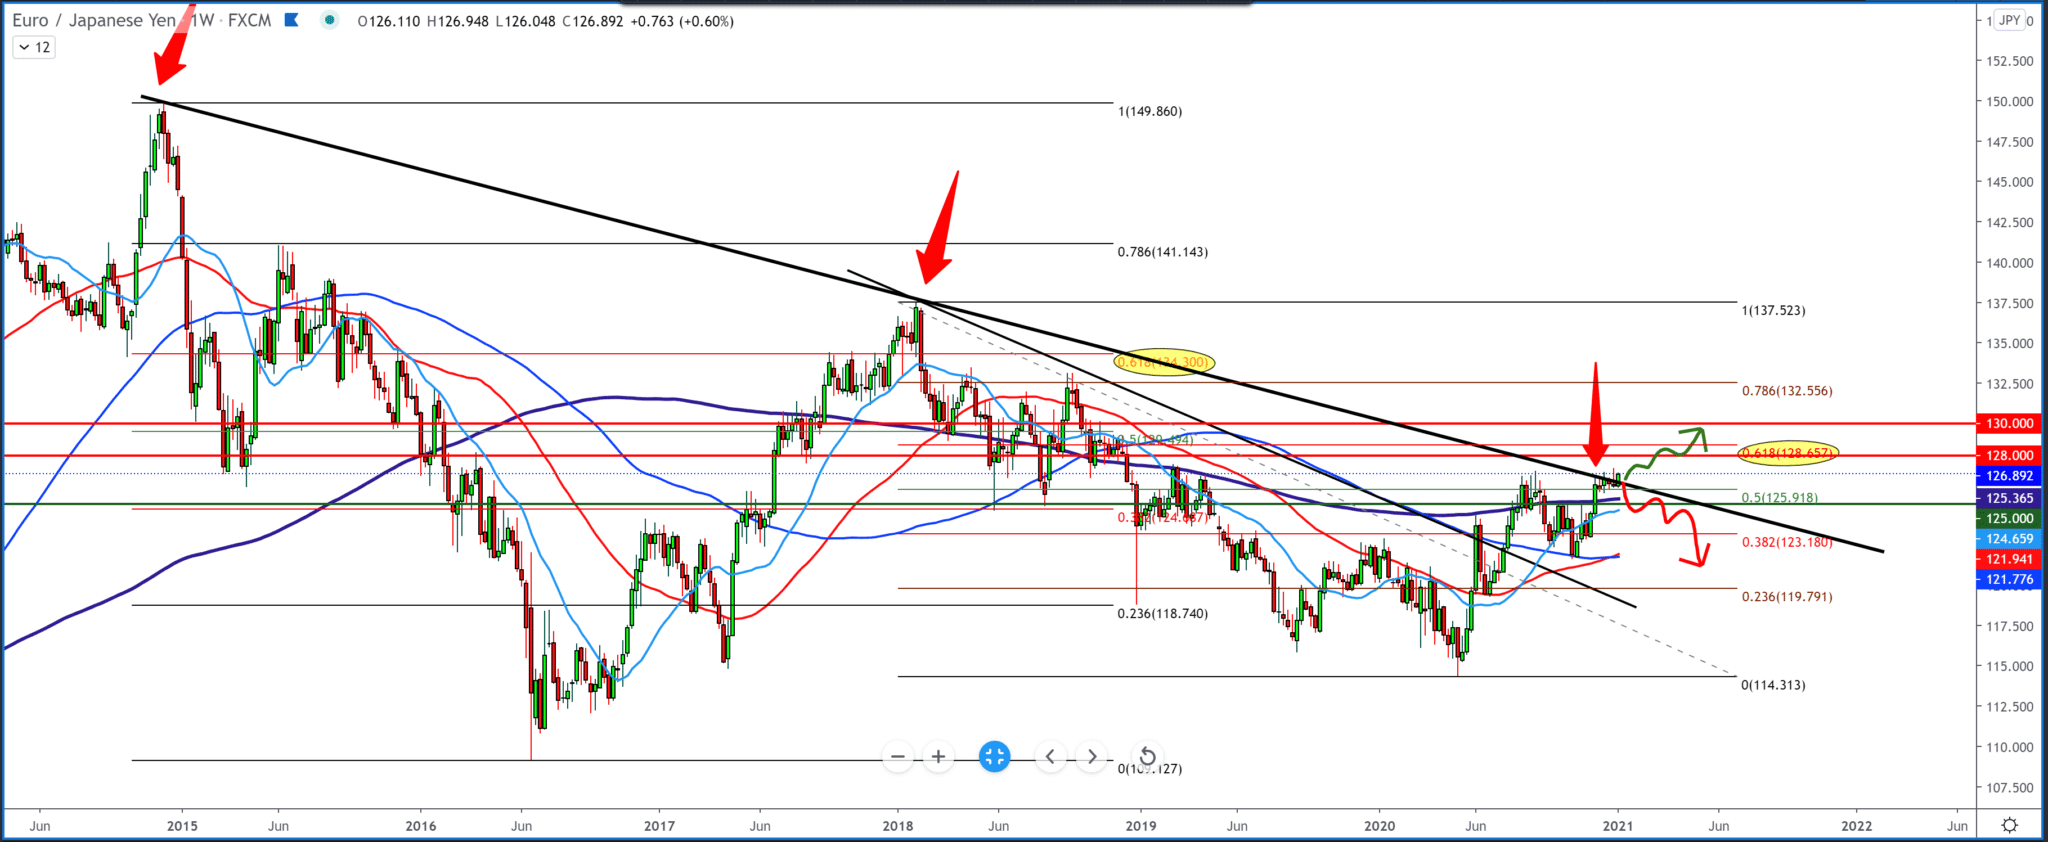
Looking at the chart on the weekly time frame, we see that the pair is at a very important place on the chart, testing a large trend line that could be potential resistance. The pair is just above the line at 126.82 and from the bottom has the support of all moving averages, especially the moving average MA200, which can be a good indicator of a future trend. The discovery of the vaccine in November coincides with the rejection of MA100, and since then, we have continued to grow from 121.00. Technically, with the Fibonacci setting, we see a break above 50.0%; consolidation above is a signal for us to continue to 61.8% 128.50. Otherwise, we go down to 125.00 for psychological level testing for investors.

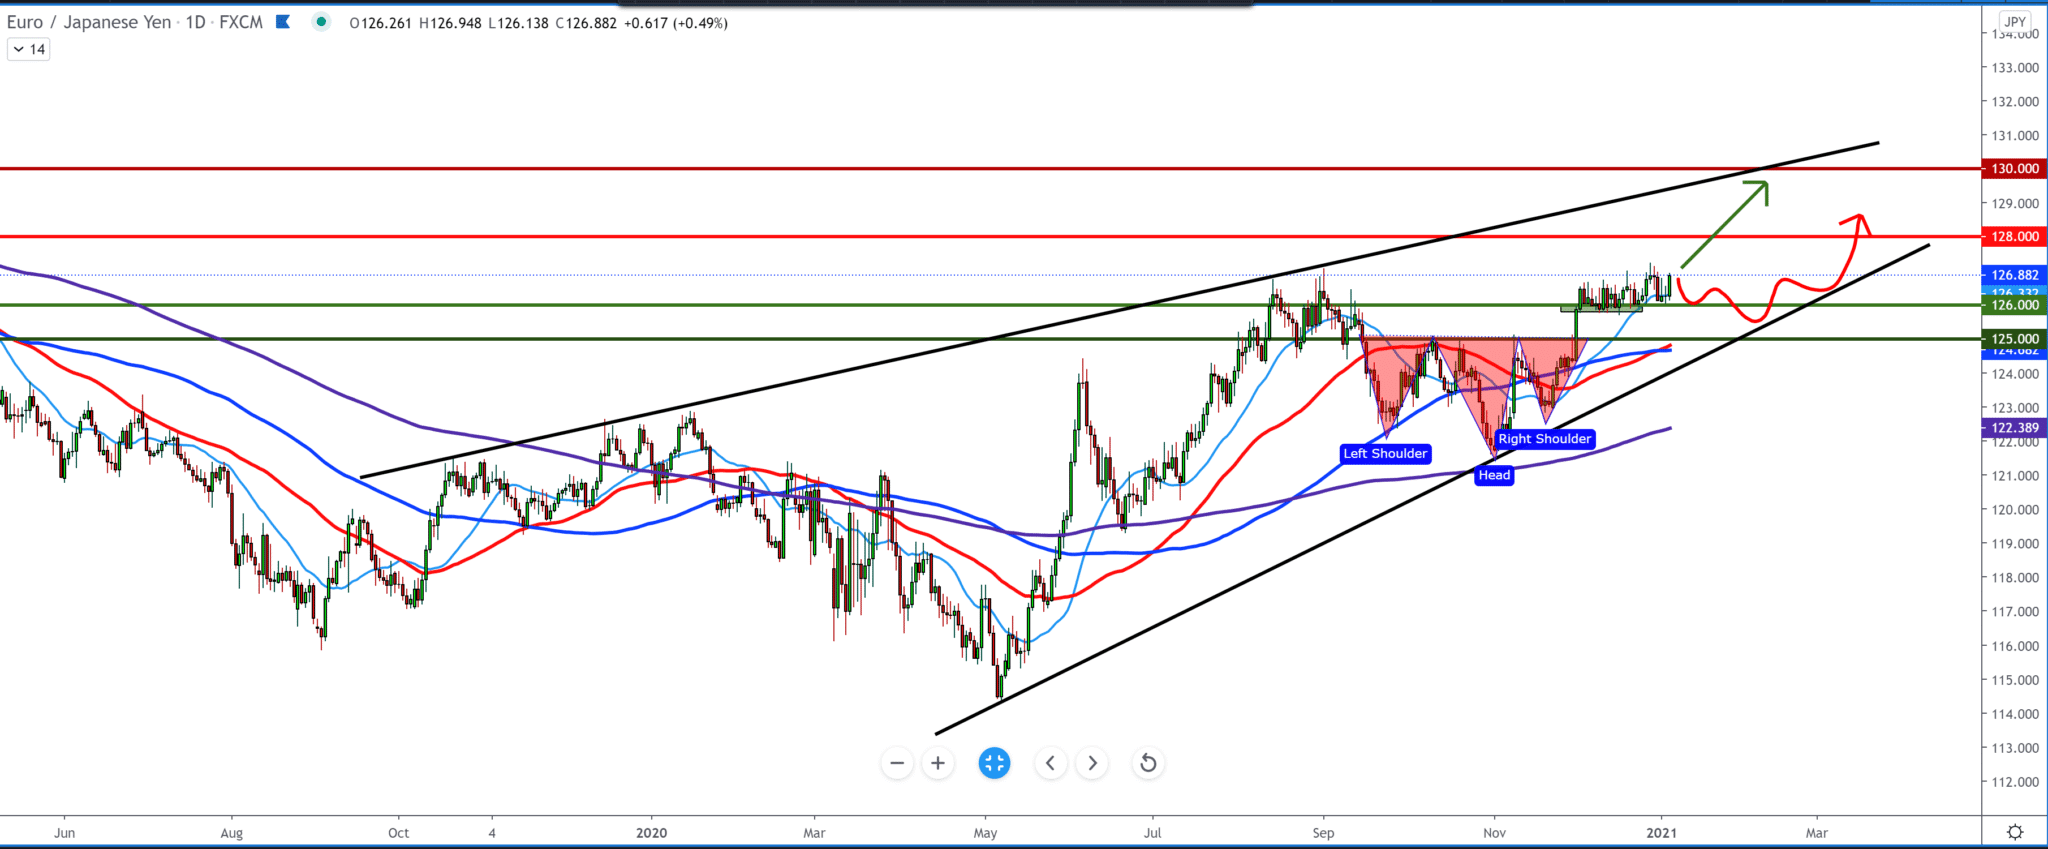
On the daily chart, we see that the pair is moving in a growing channel and that the chart has made a Head & Shoulders pattern and that after that, we have a break above, current consolidation and the potential to continue to higher levels. Now we can expect the pair to exceed 127.00 and continue towards 128.00. Otherwise, we can expect a drop to the zone at 125.00, where the pair will encounter moving averages if we see bearish candlesticks.

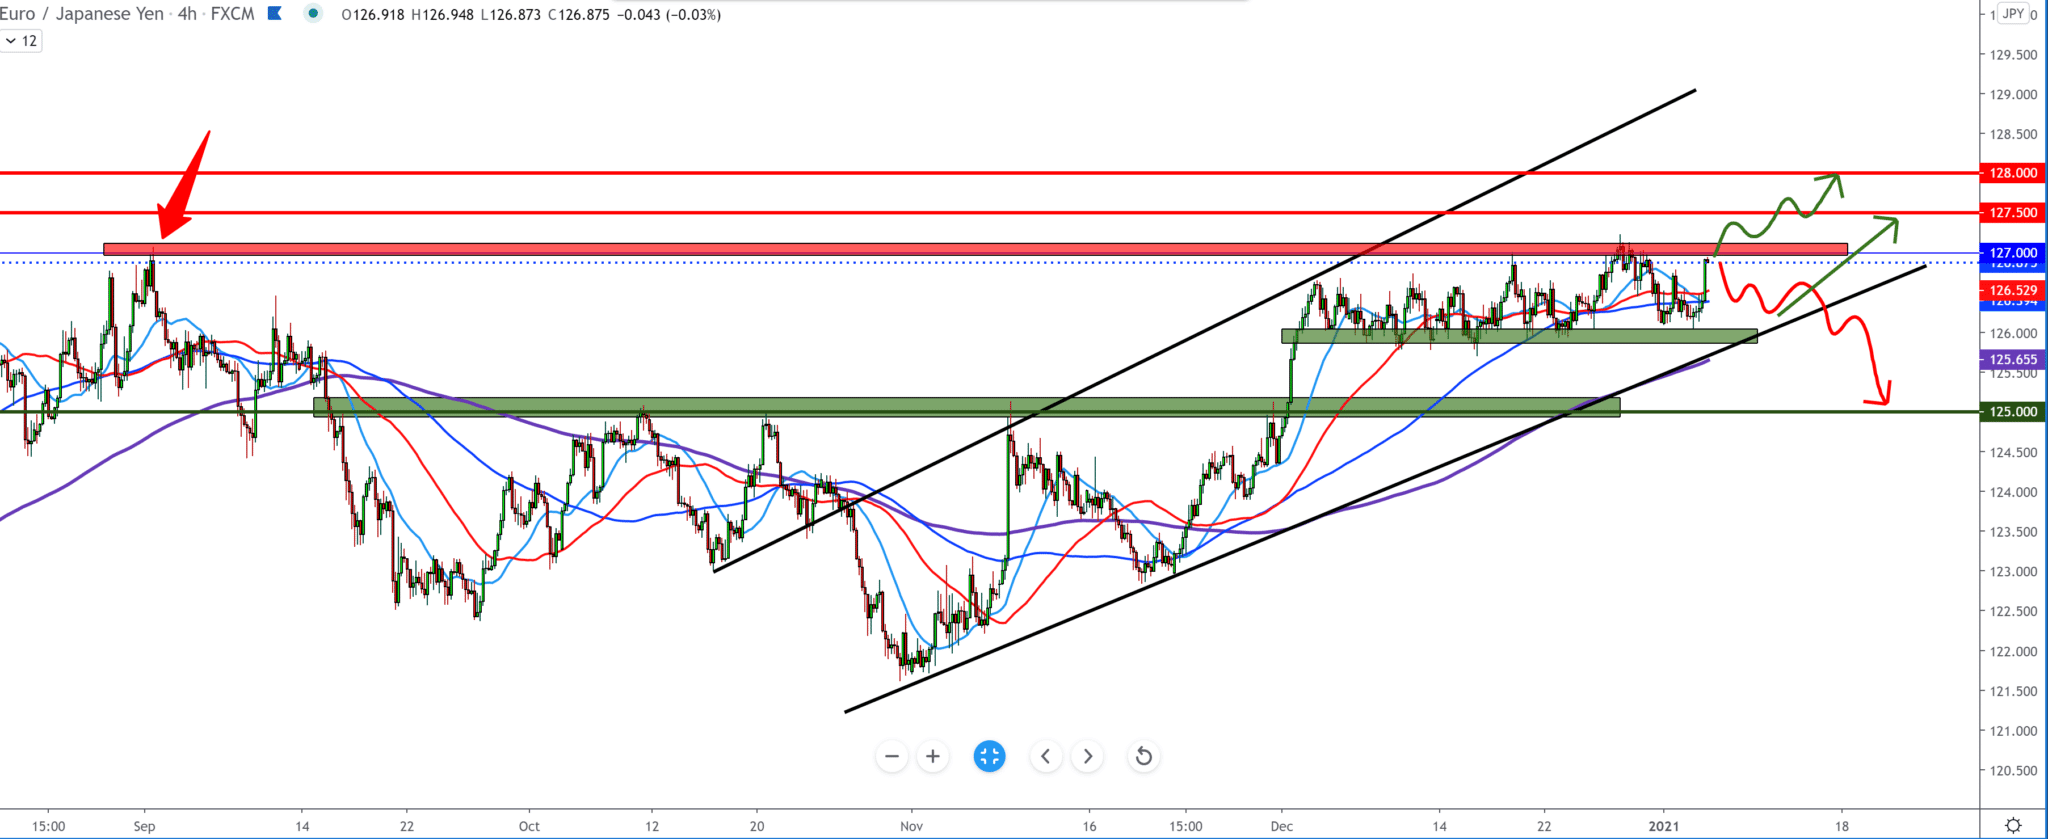
In the four-hour time frame, we see consolidation in the last month, but this movement is within the growing channel in the zone from 126.00 to 127.00. Bullish investors are now waiting for a break above 127.00, then 127.50 as a sign for the bullish trend to continue, and for the bearish scenario, we first need a break below 126.00; if we see this pullback, it will coincide with the bottom trend line. Moving averages are around 126,500 in the middle of that zone and are of no use to us at the moment.

-
Support
-
Platform
-
Spread
-
Trading Instrument


