Ethereum in Crisis – the Crypto is about to be Outperformed by BTC
The price of Ethereum surpassed Bitcoin by 175% from March 28 to May 15. The bull jump caused the token to reach a maximum of $ 4,380 for all time. However, as the cryptocurrency markets triggered a sharp decline on May 12, the trend began to reverse, and since then, the price of ETH has fallen by almost 50%.
The ETH / BTC ratio climbed again on June 8, reaching 0.77. This was despite Ether’s price remaining 36% below its highest level and hovering close to $ 2,800. To understand what could have triggered the relationship, analysts must separately analyze the drivers of Ether and Bitcoin prices.
Ether’s leap has received additional support due to intense praise from institutional investors. Traders understood the sense of urgency, known as FOMO, and immediately redirect their exposure to Bitcoin to leading altcoin.
A Goldman Sachs report found that the global investment bank believed Ether had “a high chance of overtaking Bitcoin as the dominant storehouse of value.” Ethereum maintained 80% dominance over net worth locked in decentralized financing (DeFi) applications, Binance Smart Chain reached a market share of 40% on DEKS stock exchanges.
Redesign
Ethereum is undertaking a redesign that will change the issuance rate and how entities will be paid to secure the network. Meanwhile, Bitcoin ensures that any upgrade is backward compatible and maintains its strict monetary policy. This is the main reason why Ether will not surpass Bitcoin over the next 12 months. Or at least until it is better understood how the dominance of smart contracts in the Ethereum network will be.
Professional investors avoid uncertainty at all costs, and the cryptocurrency market is full of uncertainty.

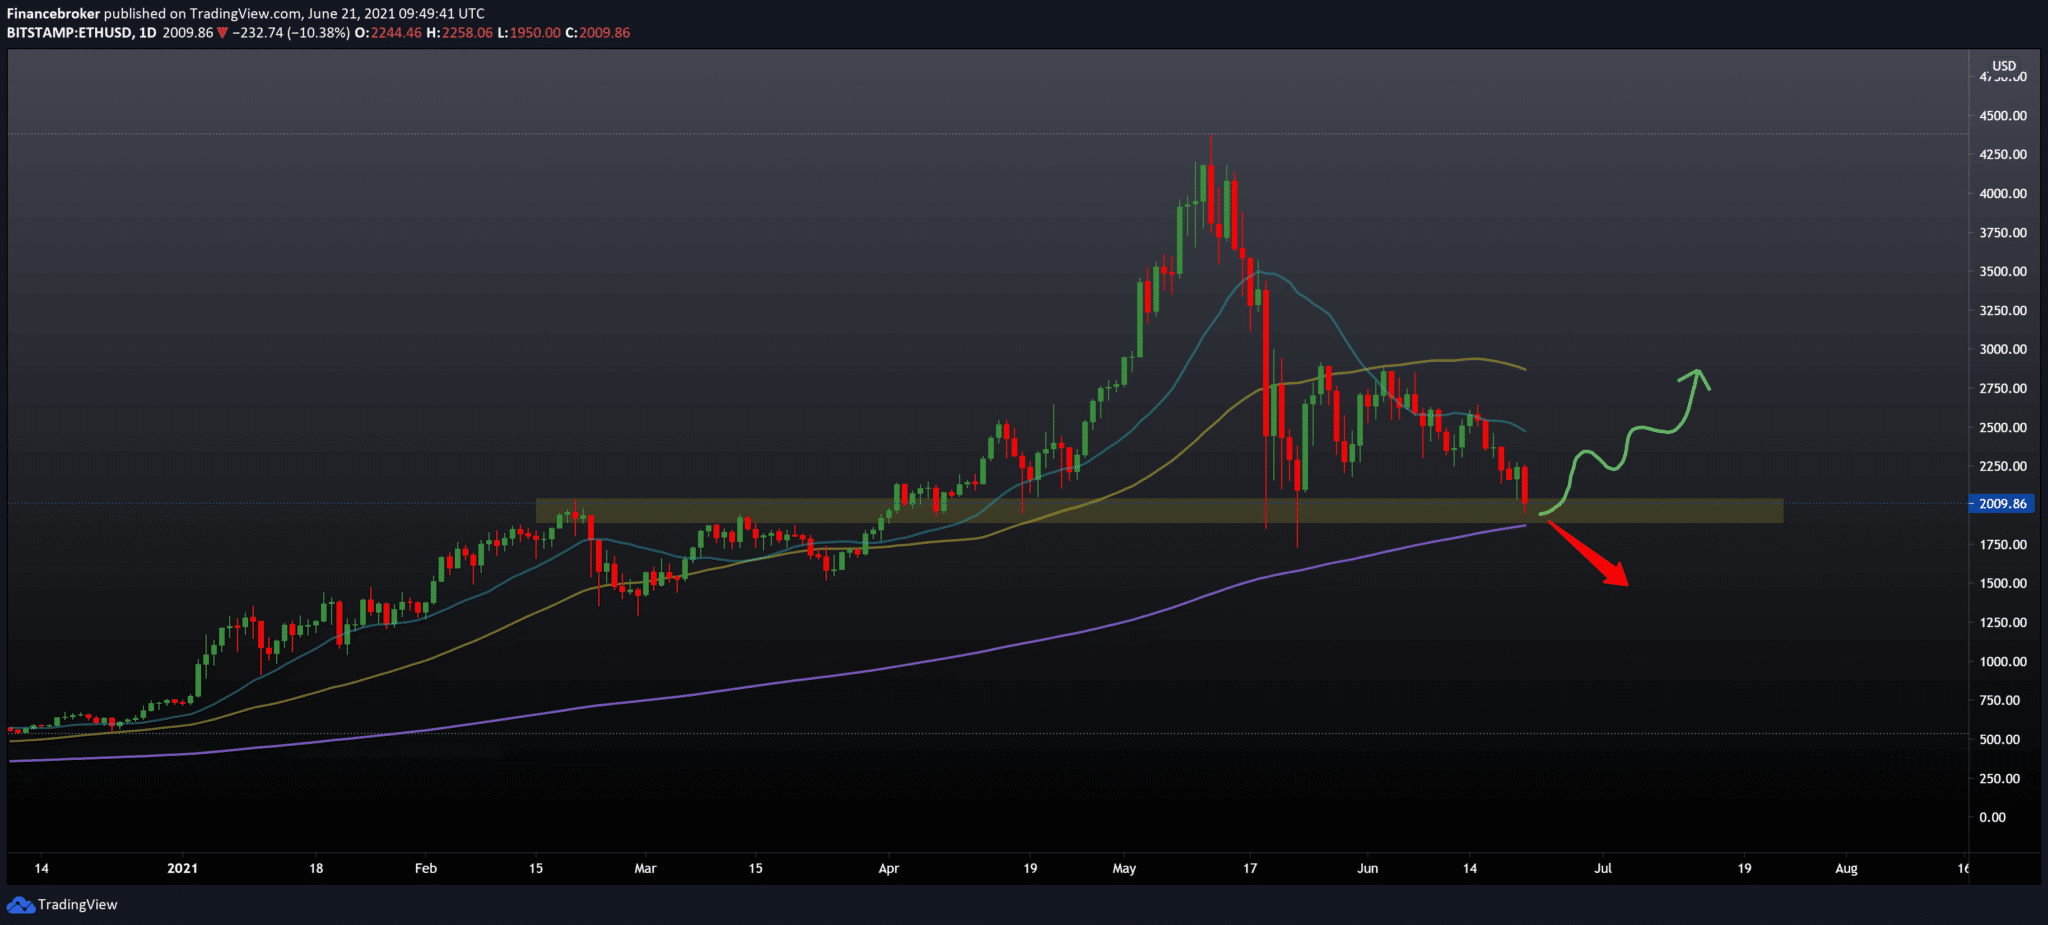
Looking at the chart on the daily time frame, we see that ETH is close to testing a daily moving average of 200 in the $ 1800-2000 zone. A break below the MA200 would open the door to $ 1500. While otherwise, if we find the support, we can see a bounce from that zone to higher levels. The moving average is just a line on the chart, while the trend is very steeply bearish with a tendency to see the price at lower levels on the chart.
-
Support
-
Platform
-
Spread
-
Trading Instrument


