Ethereum analysis for April 5, 2021
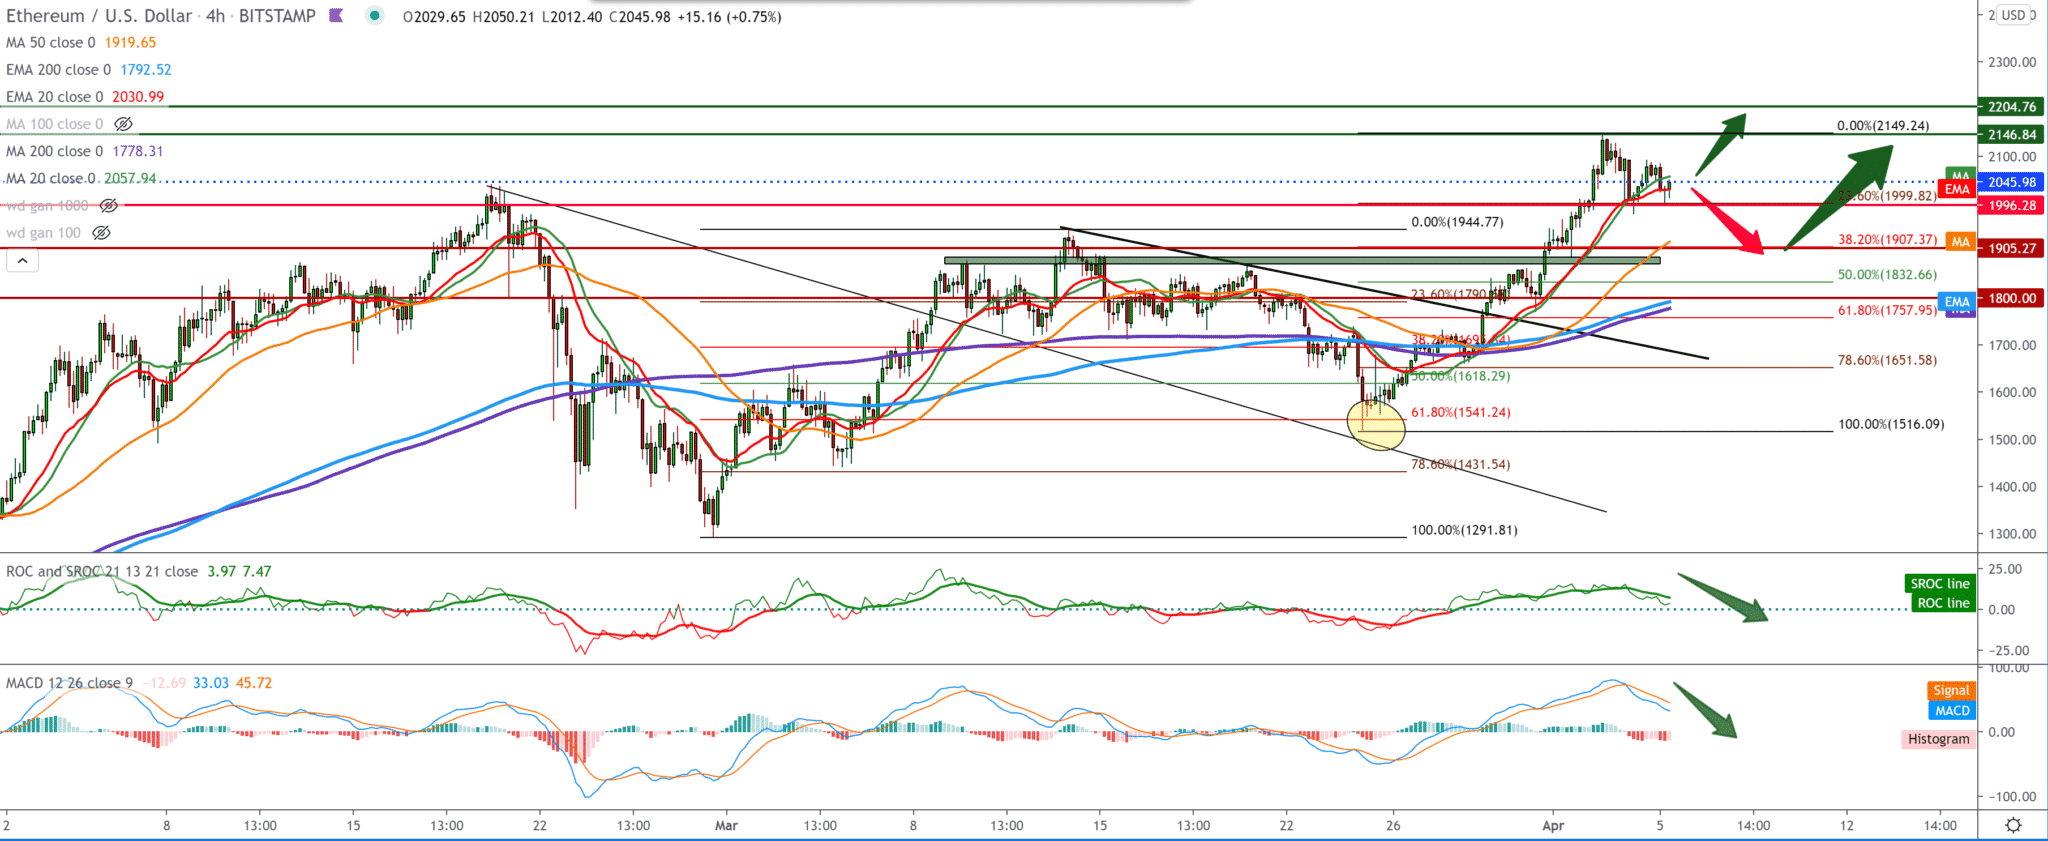
Following the chart, on the four-hour time frame, we see that Ethereum made a new historic high at $ 2146. We currently have a smaller pullback to the moving averages of the MA20 and EMA20 at $ 2040. If Ethereum runs out of power, we’ll see a further withdrawal to the MA50 at around $ 1950. for this pullback, we can use Fibonacci retracement levels; what we see first is that we are currently testing a 23.6% level at 2000%> By finding the support, we go up again, and otherwise we go down to 38.2% level at $ 1907. Previously, the pullback was up to 61.8% Fibonacci level, so that we can expect a bigger pullback than the current one. Overall, we are still in a big bullish trend.

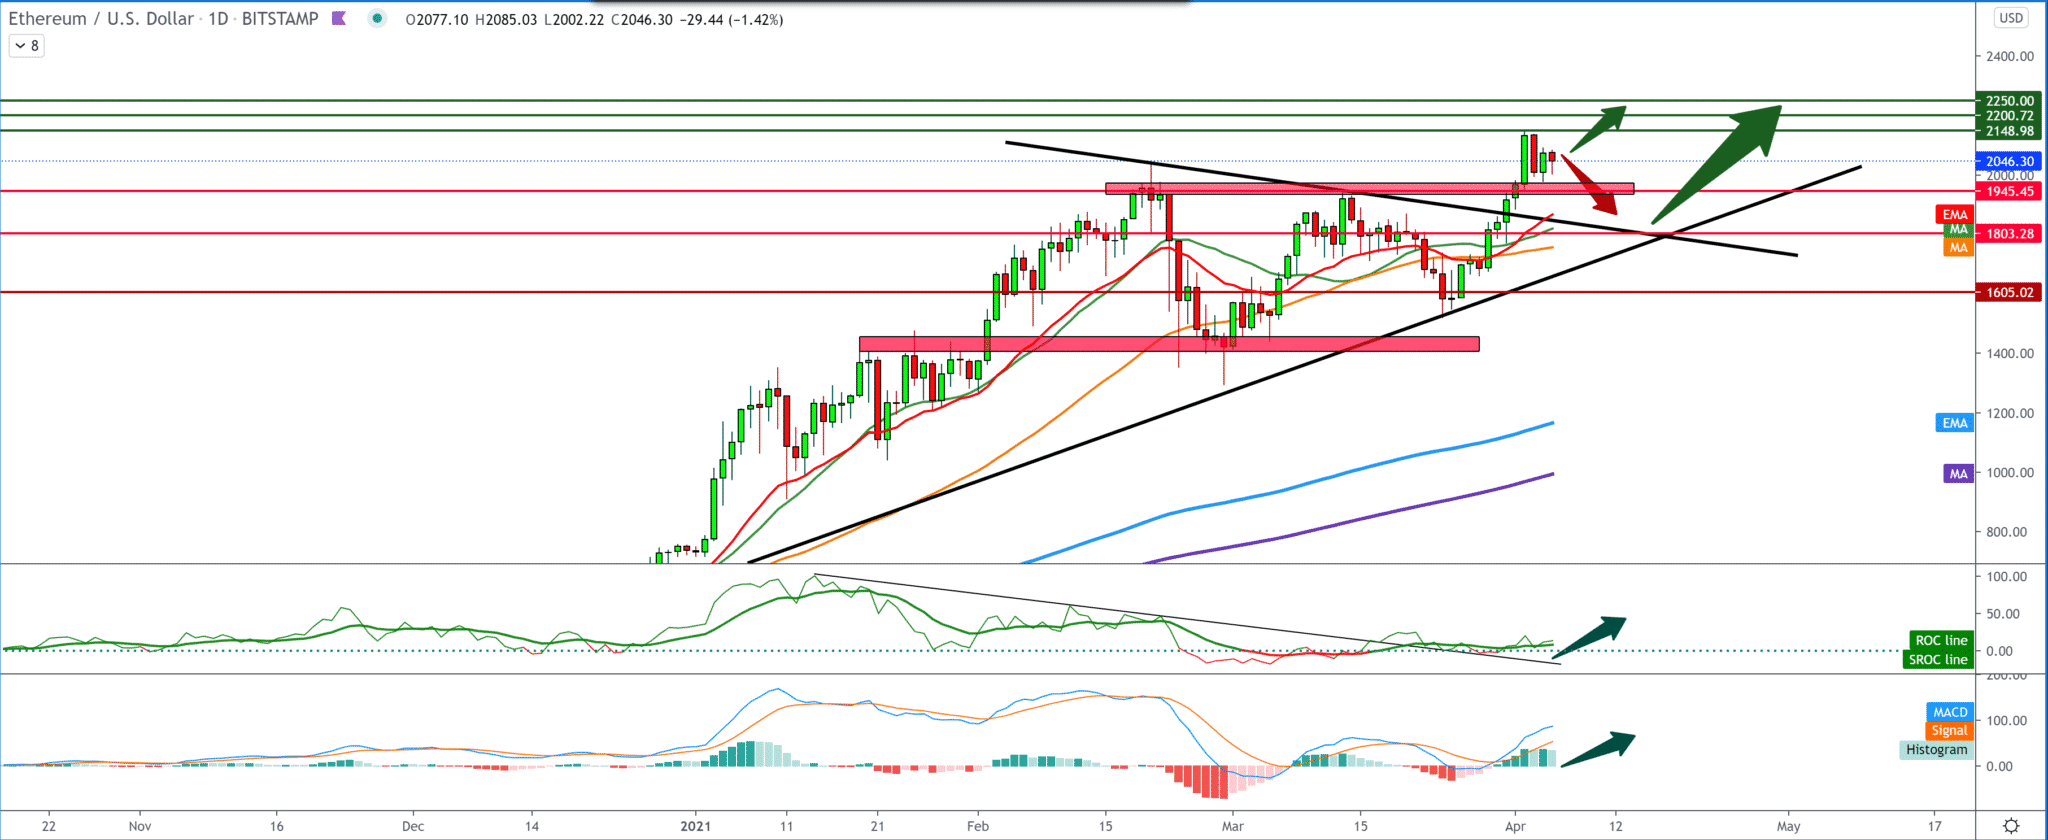
On the daily chart, after reaching the new highs, we see a pullback, support for our moving averages are below $ 1950, and we can expect a pullback to them. Below we also have one long-term trend line of support as a strong indicator of the bullish trend, and for now, it is not endangered. We are still looking at new highs over $ 2200, and we can expect that in the coming period.

Ethereum’s offer on the stock exchanges as a percentage of its total supply reached 19.83%, the level last seen at the end of December 2018. Overall, this indicator has fallen by 26% in the last year and shows that investors expect the further assessment of market value ETH shortly.
Finally, the number of whales holding between 1,000,000 and 10,000,000 ETH increased by 11%, indicating a new addition to this category. Moreover, the possession of these investors seems to affect Ethereum price movements directly. Hence, the recent jump gives a bull image.
-
Support
-
Platform
-
Spread
-
Trading Instrument


