


Ethereum analysis for April 16, 2021
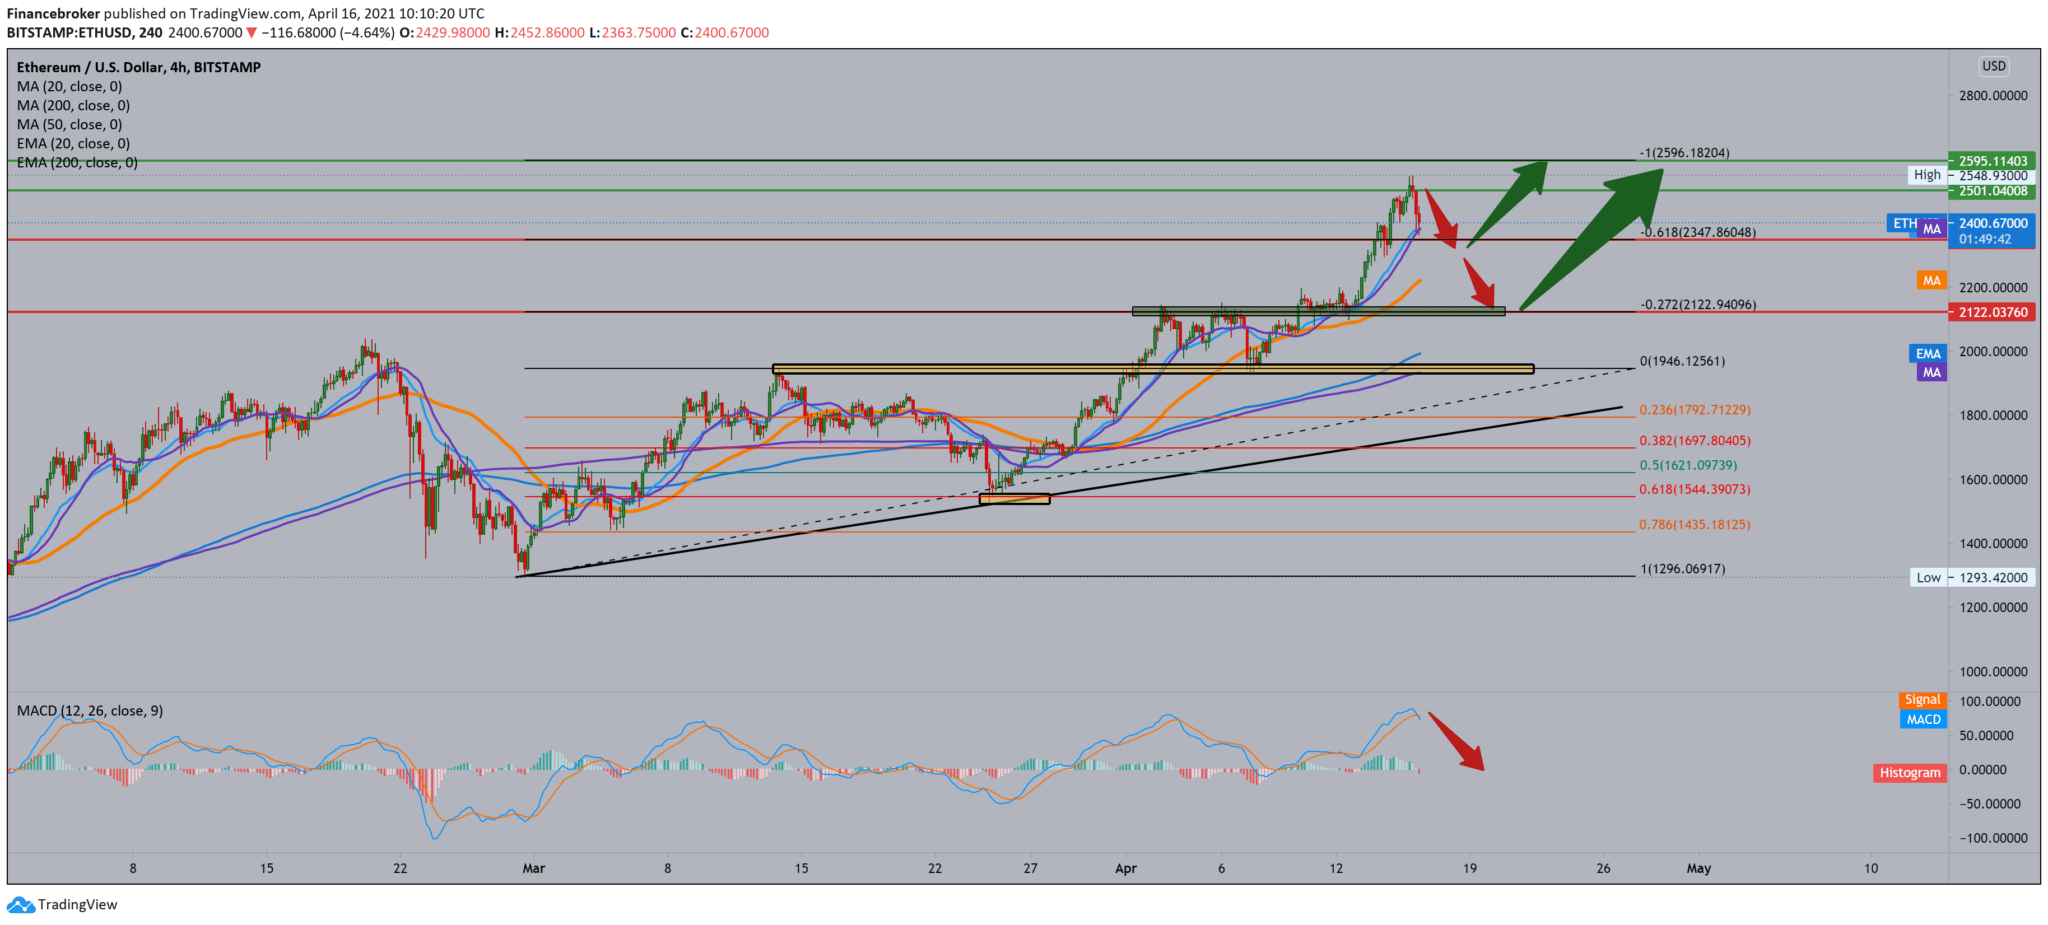
Looking at the chart on the four-hour timeframe, we see that Ethereum made a new high at $ 2548 by approaching the 200% Fibonacci level at $ 2595. After the new high, we see a pullback, and current support is at moving averages of MA20 and EMA20 at $ 2380. The break below takes us to the MA50 at $ 2200, with the probability that we will then test the potential retest zone at $ 2123.
Following the MACD indicator, we see that the blue MACD line went below the signal line, giving us a bearish signal, with the bearish trend’s potential to continue. The crypto market is on the rise, so we are in a big bullish trend in the long run.
Since the average fee for Ethereum blockchain transactions reached almost $ 40 on February 23, it is quite clear that a problem needs to be solved. One is a Defi investor who hunts for a high yield on a lending protocol or a whale that hovers around many ETH. But what about ordinary people trying to move smaller quantities, performing transactions in ERC20 tokens such as stablecoins, ERC721 tokens like NFT, or app developers trying to board new users.
Blockchain games don’t make sense with such long processing times, and other blockchain apps become unnecessarily expensive to use. It is true that the average transaction fee dropped considerably from its highest values in February, currently to around $ 19, but still, payment providers such as PayPal, in some cases, provide better rates.
-
Support
-
Platform
-
Spread
-
Trading Instrument

