


Ethereum Analysis for April 12, 2021
Looking at the chart for Ethereum, we see that we are moving in a growing channel. First, we can notice that the channel’s first pullback was up to $ 1545 at 61.8% Fibonacci levels. After that, we have continued growth to a new historic high at $ 2200, just above 127.2% Fibonacci level. If any continuation of the momentum is likely, we will see a jump to $ 2346 at 161% Fibonacci level, followed by a probable pullback.
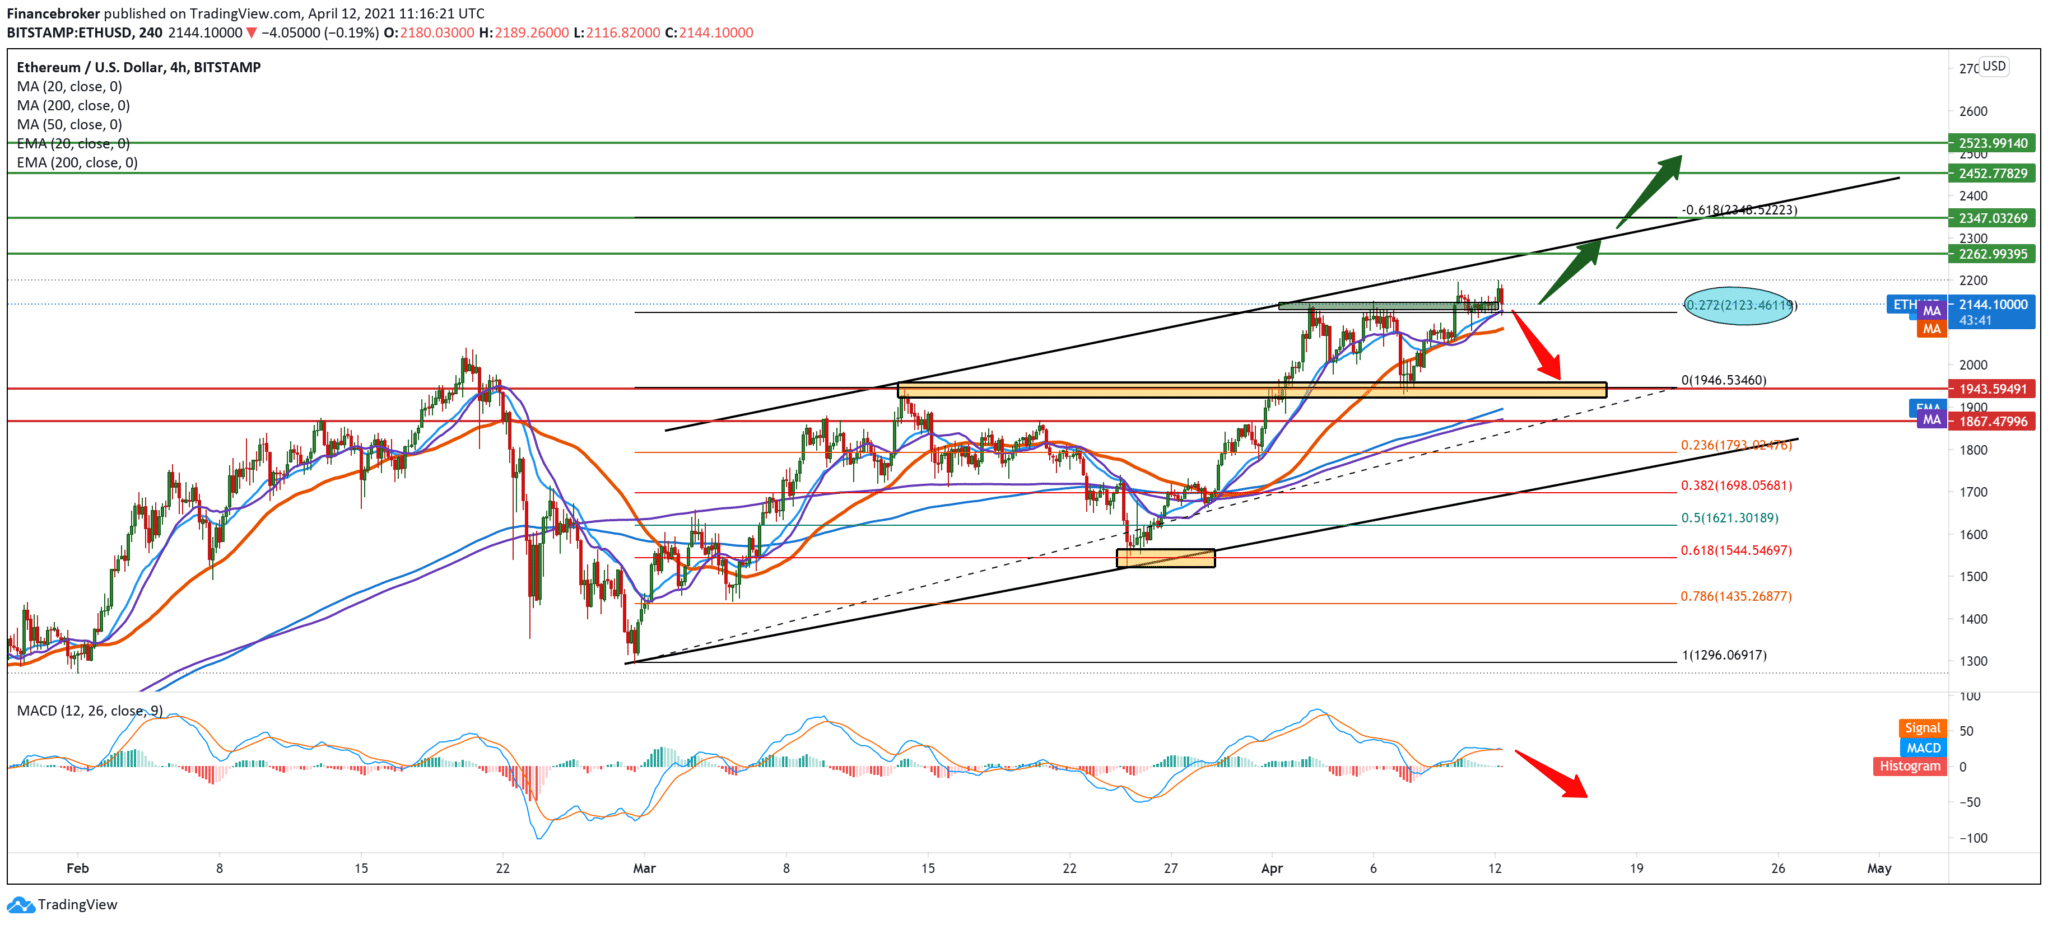
Our second scenario is a pullback from this current position below the moving averages of MA20, EMA20, and MA50, targeting the previous higher high at 1349% seeking support at the previous retest point, where the MA200 and EMA200 await us.
The break below them lowers us to the bottom line of support of this growing canal. Following the MACD indicator, we see that it is indeterminate, it is on the bullish side, and there is no clearer signal for a potential continuation of the trend. Still, some pressure could give a shorter bearish signal. The trend is generally bullish, and it would only be a corrective pullback that seeks better support on the chart.
According to professional trader Scott Melker, Ethereum’s “huge growth potential” could overshadow Bitcoin this year. Melker sees this period of Bitcoin price consolidation as particularly bullish for the second-largest cryptocurrency, which has recently reached new highs of all time.
Melker sees the outstanding performance of Etra as the main catalyst of the recent bull race in the altcoin market. He also revealed that he has largely switched his strategy of averaging dollars from Bitcoin to Ethereum to use Ethereum’s huge growth potential in the last few months.
-
Support
-
Platform
-
Spread
-
Trading Instrument

