


Dogecoin analysis for April 22, 2021
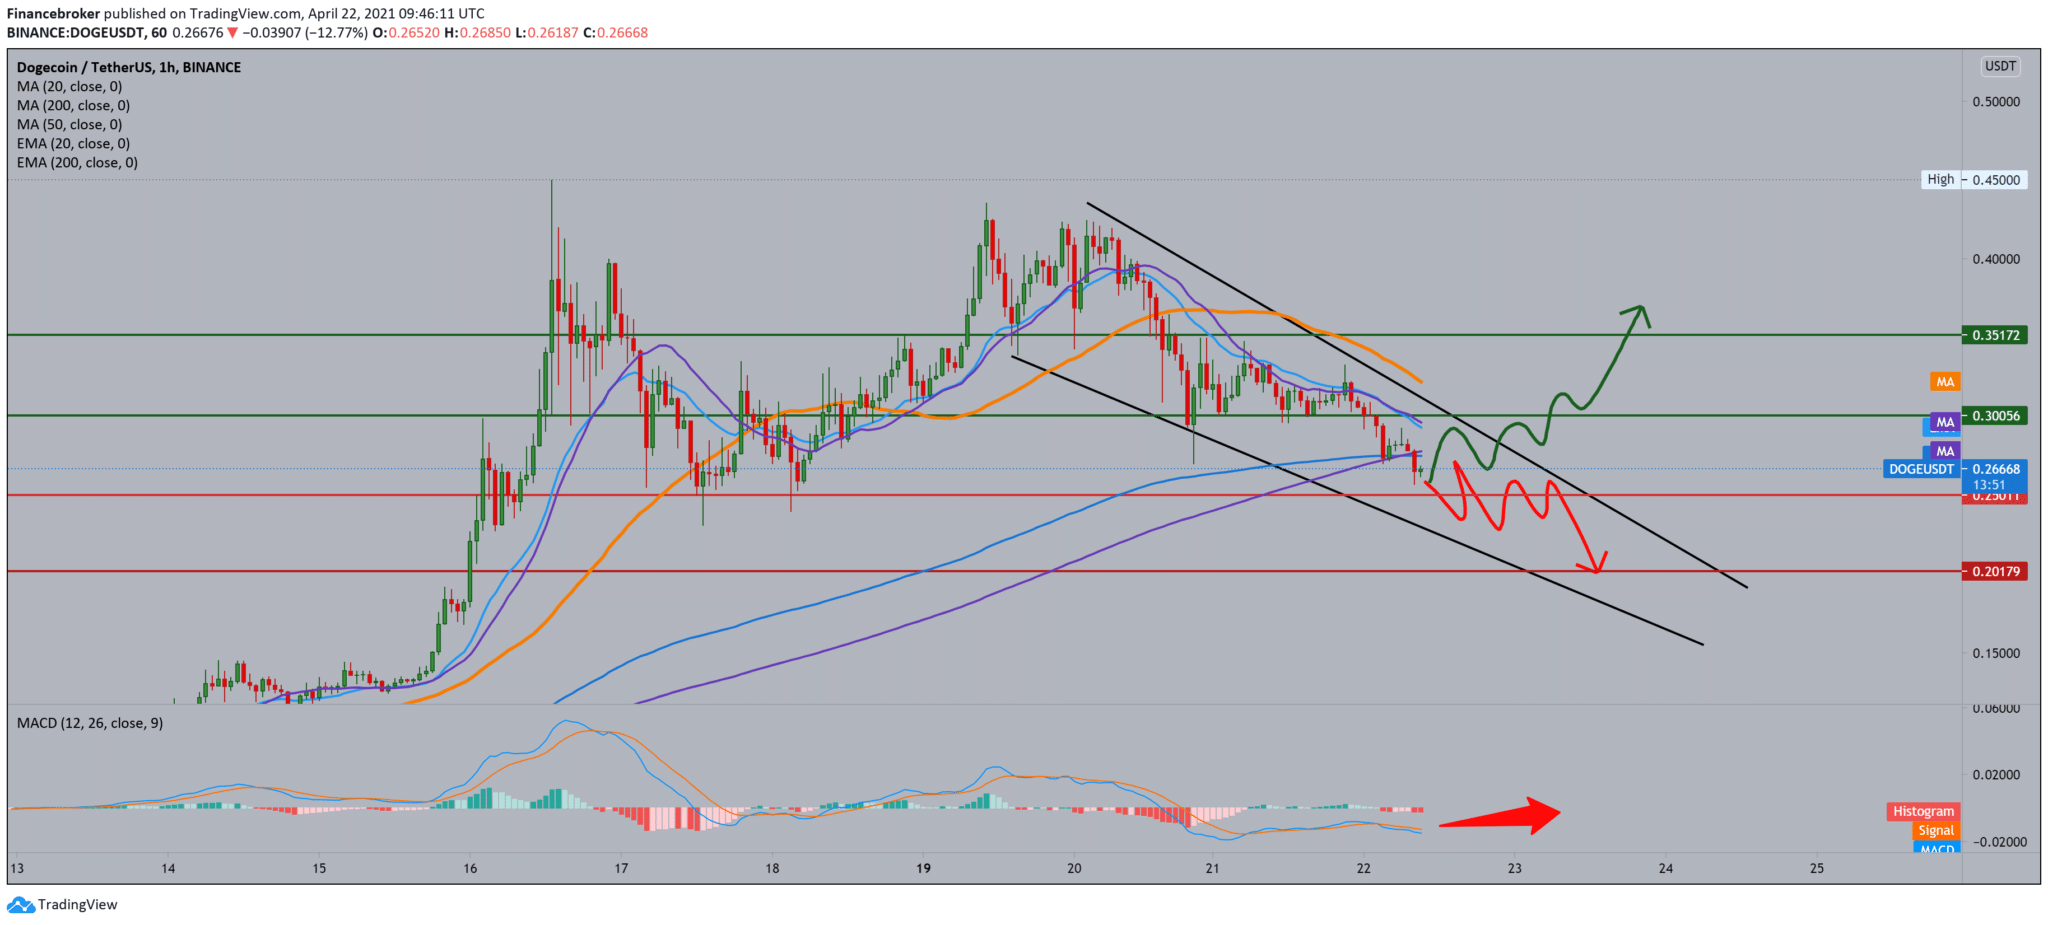
Following the chart, on the hourly time frame, we see that we now also have a big pullback after the big jump of the previous days. as if everything had turned around, moving averages are on the bearish side. Even Dogecoin fell below MA200 and EMA200, testing the zone again around 0.25000. The break below us leads to 0.20000, and that would be a catastrophic drop after the great bullish potential we had in the previous days.
Looking at the MACD indicator, we see that the volatility is very low. There is no interest, or everyone is waiting for the price to fall further to buy Dogecoin at even lower levels on the chart. The MACD is deep in the bearish zone, and the chart is an hourly time frame, and that can change very quickly.
Although technical people point to the bull image if the demand zone holds, the metric indicators on the chart suggest that investors are uninterested in the meme coin and are slowly withdrawing from Dogecoin. If this trend continues, the price of Dogecoin could be seen to a limited extent in the near future.
According to IntoTheBlock’s IOMAP (In / Out of the Money Around Price – IOMAP) model, nearly 47,000 addresses that bought Dogecoin’s $ 12.63 billion for $ 0.32 are “No Money.” Therefore, the short-term jump in buying pressure will face sales pressure around this level by investors who may want to achieve a balancing result.
Besides, the lack of support levels makes bulls more challenging, adding confidence to a potential decline in favor of vendors.
-
Support
-
Platform
-
Spread
-
Trading Instrument

