Current recovery of Bitcoin and Ethereum prices
Bitcoin chart analysis
Bitcoin fell to a three-month low amid nervousness over-tightening U.S. monetary policy and shutting down the Internet in Kazakhstan, the world’s second-largest bitcoin mining hub. According to Coin Metrics, the price of bitcoin fell below the limit of 41,000 dollars to 39,675 dollars, reaching the lowest level since September 21. The world’s largest cryptocurrency started to fall earlier this week after the minutes from the December meeting of the Federal Reserve indicated that the American central bank would withdraw its stimulus from the pandemic era. “Hawk’s Comments” triggered a sell-off on global stock exchanges that spilled over into cryptocurrencies. Crypto bulls often describe bitcoin as an asset unrelated to traditional financial markets, but experts have noticed growing parallels in the movement of bitcoin prices and stocks. Other digital currencies continued to fall, with Ethereum weakening 6.8 percent and Solana 7.7 percent. Another piece of news that affects the prices of cryptocurrencies is the move of the President of Kazakhstan to turn off the Internet service after the deadly protests against the government. According to the Cambridge Center for Alternative Finance, the Central Asian country accounts for 18 percent of the bitcoin network. Many cryptocurrency miners have fled China to neighboring Kazakhstan over Beijing’s ban on virtual currency mining. The computational power of bitcoin is not directly correlated with the price of bitcoin. Still, it indicates network security, so a decline may scare investors in the short term.
Bullish scenario:
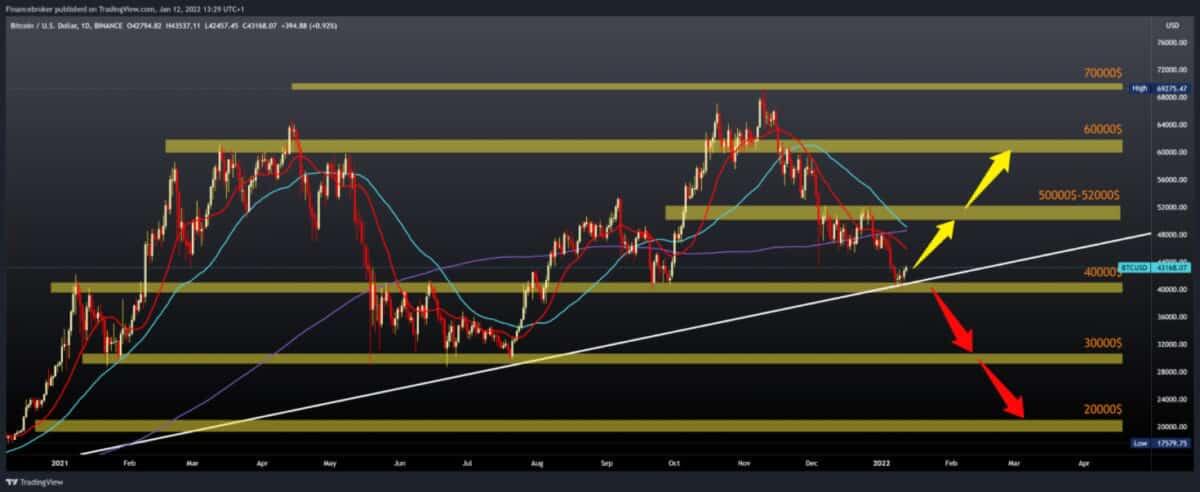
- The price of Bitcoin began to recover yesterday, moving away from the $ 40,000 level. We are currently at $ 42,950 and are slowly climbing towards the MA20 moving average.
- If this positive consolidation continues, we can expect the price of Bitcoin to rise to the previous support zone of around $ 45,000-46,000.
- Going above, we come across the next resistance at $ 48,000 and the MA50 and MA200 moving averages.
- Our main target is the previous resistance zone of $ 50,000-52,000 from the end of December, and if the price reaches that zone, we can say that we are returning to the bullish scenario.
Bearish scenario:
- We need a negative consolidation that would lower the price of Bitcoin to the $ 40,000 zone again.
- We have additional support at that level in the bottom trend line from the bottom.
- The break below opens up space for us towards a large support zone of around $ 30,000. The last time we were there was in July last year.

Ethereum chart analysis
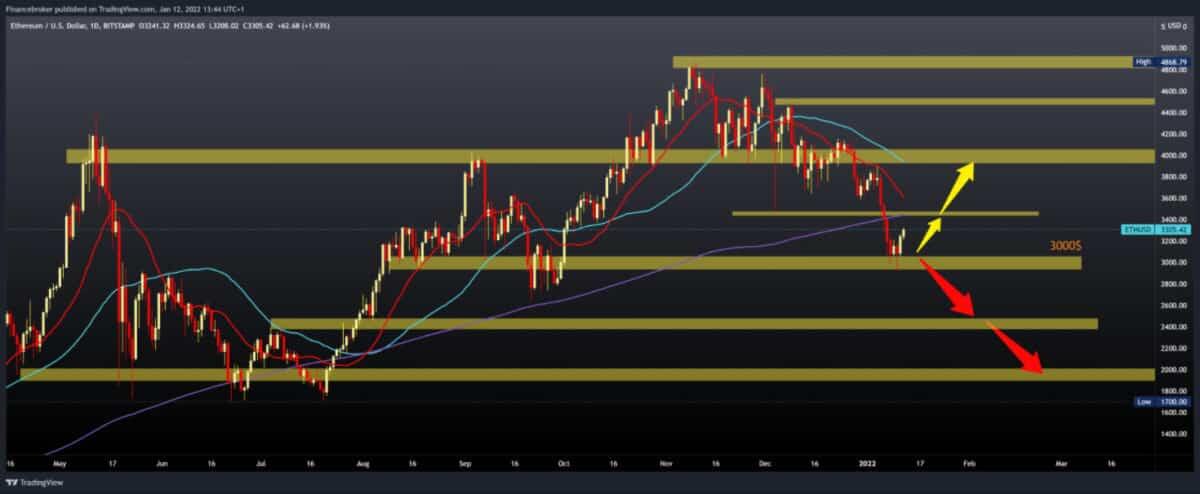
The price of Ethereum is stable for now, we found support at $ 3,000, and now it is at $ 3,300. Soon we could climb to $ 3400, where the MA200 moving average awaits us. Up there, we are also close to the MA20 moving average following the price since the beginning of the bearish trend.
Bullish scenario:
- We need further positive consolidation up to $ 3400, and the MA200 is moving average.
- The break above directs us further towards the MA20 at $ 3600, then our next resistance is at 3800 with the MA50 moving average.
- A jump above $ 4,000 brings us back to the bullish trend with increased investor optimism.
Bearish scenario:
- We need a new negative consolidation, which would lower the price again to the previous support zone of around $ 3,000.
- Then the next support is in the $ 2600-2800 zone.
- In the following, the next support is at $ 2,400, while psychological support is waiting for us at $ 2,000.

-
Support
-
Platform
-
Spread
-
Trading Instrument


