Continued consolidation for Bitcoin and Ethereum
Bitcoin chart analysis
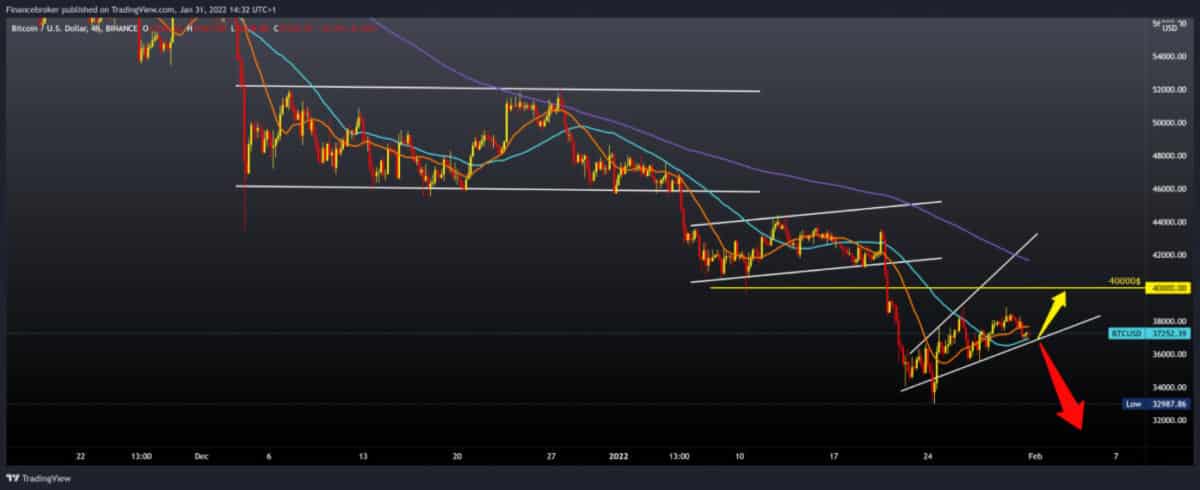
Currently, the BTCUSD market seems to be on the verge of losing momentum again. We are looking down again as the crypto-economic price reverses the movement of the gathering to the current $ 37,000. Therefore, the stress of long positions would now have to be suspended for some time until better conditions are met on the chart. The price may go headlong low until it finds support around $ 32,500 or $ 30,000, after which those in long positions can reposition themselves for the second round of BTC purchases.
On the bearish side of this analysis, the BTCUSD market for short-term positions now continues to sell positions as long as the $ 40,000 resistance remains unbreakable upwards. Sales pressures need to be sustained, moving through some support levels between $ 37,500 and $ 35,000 on a minimum basis to agree with the fact that the downturn cycle is still ongoing.
Today, the price of BTC fell after yesterday’s decline from the recent high of $ 43,500. However, if the bears fall below support at $ 37,000, sales pressure will increase again. The Bears will try to push the price of BTC to current support at $ 33,600. Breaking below current support will cause bitcoin to drop to a psychological level of $ 30,000.
Bullish scenario:
- We need to continue this positive consolidation from January 24, and we need to stay above the MA50 moving average.
- It is also important that we stay above the $ 37,000 and lower trend line of support.
- A break above $ 38,000 would help us try to attack the $ 40,000 resistance zone and the MA200 moving average.
Bearish scenario:
- We need negative consolidation and pulling the price below the MA50 moving average and bringing the trend line.
- A break below the support line and $ 37,000 would increase bearish pressure.
- Our first support is at $ 35,750, and if it doesn’t last, the next one is at $ 34,000.

Ethereum chart analysis
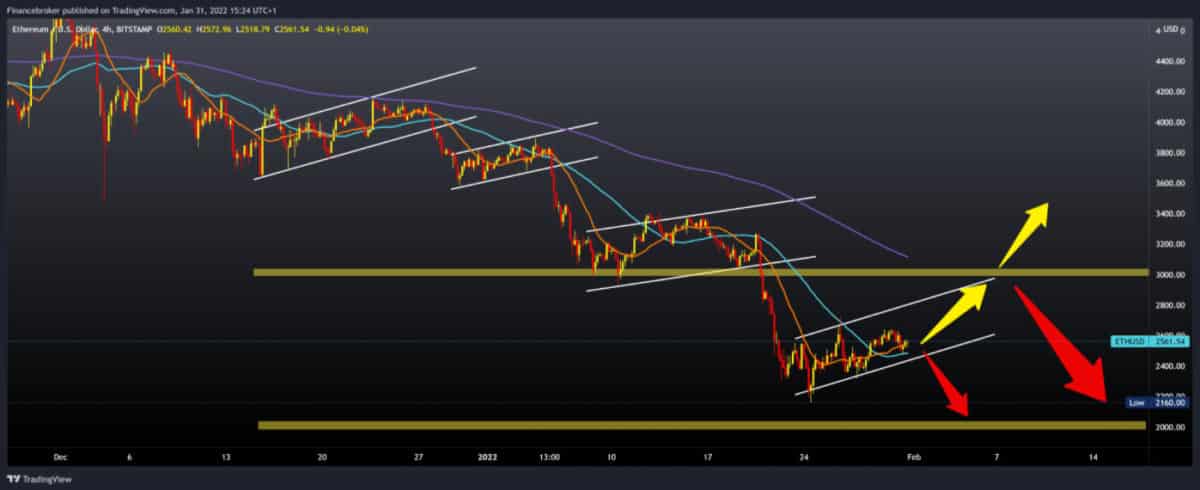
After reaching this year’s low on January 24 at $ 2160, the price of Ethereum is in positive consolidation forming a smaller rising channel on the chart. The Bulls have the difficult task of continuing the upward trend as they need to overcome resistance zones between $ 2,600 and $ 2,800. We currently have support in the MA20 and MA50, and we can expect a further price recovery to the MA200 moving average, which is in the $ 3,000 zone.
Bullish scenario:
- We need to continue this positive consolidation within the current growing channel with the support of the MA20 and MA50 moving averages.
- Then we have to pay attention to the previous resistance zone at $ 2630.
- We need a break above, and after that, we can expect a price jump of up to $ 2800 first.
- If the bullish trend continues from over $ 2800, our next target is the zone around $ 3000, where the MA200 moving average awaits us.
- The last time the price of Ethereum was above MA200 was on December 9 of the previous year.
Bearish scenario:
- We need negative consolidation and a price retreat below the MA20 and MA50 moving averages and below the bottom trend line.
- Break below, lowering us to the first potential support zone around $ 2400.
- If it doesn’t hold up, we’re looking for the next support zone for around $ 2,200, also testing last week’s low at $ 2,160.
- The psychologically larger support zone is price at $ 2,000.

Market overview
Last week, according to a “memorandum on national security,” the Biden administration said it would analyze cryptocurrencies with the intention of building a regulatory framework.
The threat of stricter crypto regulations is nothing new. But this time, given the increased priority of the central bank’s digital currencies, some say the new regulations provide an ideal background for removing decentralized opposition.
The Fed was somewhat reticent about its position with the CBDC. Two weeks ago, she published a study that explores the advantages and disadvantages of the digital dollar. But most importantly, the report did not take “any position” on its publication.
Bank of America strategists say the digital dollar is “an inevitable evolution of today’s electronic currencies.” They expect to arrive between 2025 and 2030.
-
Support
-
Platform
-
Spread
-
Trading Instrument


