


Bull Trap Trading Pattern – A must learn trading strategy
The bull trap is used to call a familiar trading chart pattern that often occurs in Forex, Futures, and Stock markets. The pattern is also known as the “upthrust,” the term which came from Richard Wyckoff, founder and onetime editor of Wall Street Magazine. Most experienced traders use this chart pattern to look for trapped traders and benefit from the scenario.
As you may know, in a bull market prices are rising constantly, encouraging market participants to buy assets based on positive trend predictions and expectations.
But, the bull trap is a price movement when the price for an asset (forex, stock, futures) is increasing sharply after some notable price decline. Shortly after that, an asset is rapidly dropping even further below the resistance point price. So, essentially a bull trap situation puts traders on the wrong side of the price action.
The bull traps occur for many reasons, for example when the traders see that the stock price they are willing to purchase is declining. They decide that it is the right time to purchase stocks at price below the fair value or at the value close to their perceived resistance point.
Such investors are called bullish investors. Demand from them as well as the demand from short traders increases stock price. Shortly after them, other traders and market participants enrol in trade, while having fear of missing a great price opportunity.
At some point, investors who bought shares or currencies may decide to sell them off at a premium price and earn huge profits. This results in a sharp increase in supply and a decrease in prices. Typically, this new price is much lower than the one at the beginning of the bull trap. So a bull trap can be identified as a kind of false signal that may cause investors to lose money.
Technical Analysis
Financial market behaviour is irrational when investors react without meticulous thinking, without their decision to buy or sell not being based on systematic analysis.
According to the theory of efficient markets forged by the American economist Eugene Fama (Nobel Prize in Economics 2013), stocks always trade at their fair value. Over or under-valued stocks would therefore not exist. The market reacts predictably when investors have the same information. The bull trap trading pattern represents some of that information.
Basically, a bull trap pattern is a bearish signal forming within an uptrend, which usually occurs at a major resistance level. Acknowledge that it is not expected to be on an all-time high. Remember that you need to look for a bullish trap in the bullish market, not in the bear market. There are some examples that could catch a turnaround, but consider this pure luck.
What really is the bull trap chart pattern?
- The market price is in an uptrend then hits the resistance level, breaks out from it and then continues to move higher.
- Traders who reach a breakout jump in with buy orders and price shoot up.
- Traders are to sell limit short triggers yet prices still move up hitting their stops.
- When liquidity dries up within these levels, market price falls back in the resistance zone. Or even below the existing resistance zone.
- Traders are placed short, breakout then jumps in to take back their loss, then get rejoined after being stopped.
- Bullish investors get trapped by a short-term increase in price, they buy more shares that drop even further in price.
Why identify them as “trapped traders?”
- Trapped traders are taken and trapped out of the market.
- Long positions are in the market, prices are pulled back and catch them while wanting a rebound.
Assets’ price movements during a bull trap
The bull traps occur in stock markets when shareholders, duped by a short recovery and false signal, buy securities whose ratings soon collapse again. Since losing your money is not an option generally, you should absolutely avoid bull traps during your trades. The first rule to avoid bull traps is to monitor support and resistance levels. Avoid buying any asset at resistance levels if you want to avoid losing your money.
The mechanism of the rising trap evokes a mousetrap with the difference that it is not a piece of cheese but a rise that acts as bait. The phenomenon takes place as follows.
After a period of growth, investors anticipate the price decline of an asset. As a result, they reduced their positions before the decline began. These sales cause or accelerate the drop in prices.
After this decline, a further increase occurs. Mechanically, shareholders are starting to massively acquire again to take advantage of this trend without questioning its financial justification.
The bull trap opens if this recovery does not hold, and it is followed by a new phase of decline, generally more pronounced than the first. Shareholders become caught in the trap they have no choice but to turn their backs and wait for better times while keeping their assets or liquidating their positions by taking losses.
Bull trap and bear trap
The bear trap (downside trap) works according to the opposite logic, mirroring the bull trap. The first victims are the short-sellers, not long position holders.
This time, investors are convinced that a security’s future results will fall while its trend is bullish. They become deluded from a spurious bearish signal. Short-sellers are forced to buy more expensive shares when the trend turns upwards and prices rise against predicted future results. Then they sold them to close their positions.
Bull trap pattern trading
Chart patterns may occur in various forms, yet it is the main form. There’s just a need to look for a candlestick that is extremely bullish, breaks the resistance level, then turns bearish.
Let’s examine and illustrate the most common and obvious types of bull trap patterns.
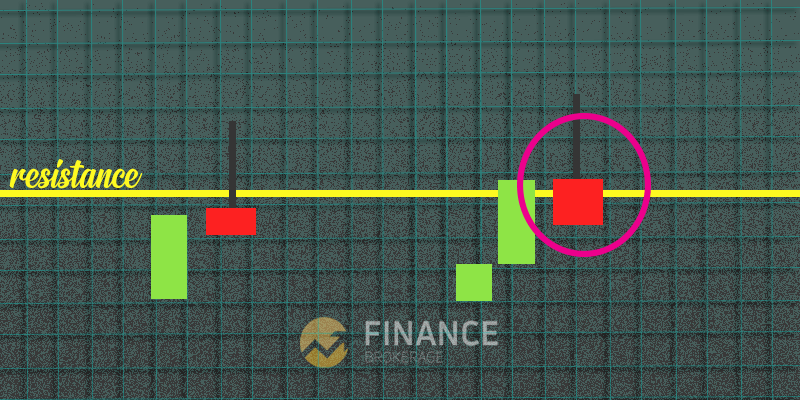
Pattern #1 – Bull Trap Trading
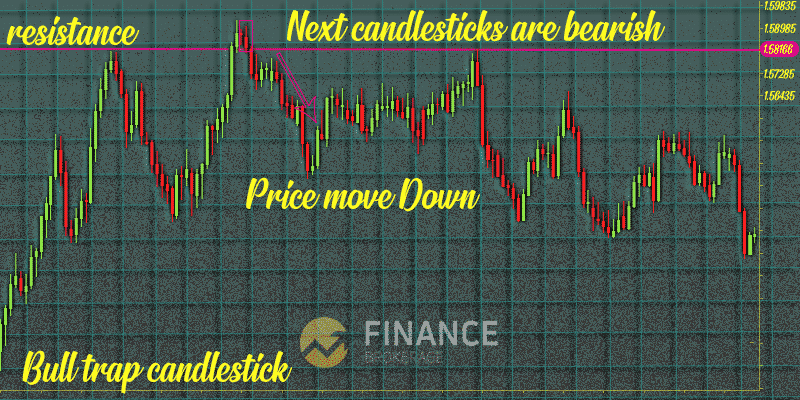
On this first pattern that we’ll focus on, the bull trap candlestick breaks then close above the resistance zone, yet the nest 1st and 2nd candlesticks after it are bearish.
- It will indicate an obvious resistance level.
- Candlestick pattern breaks out the resistance level and might close over it.
- The second candlestick upon breakout is most probably bearish.
- Keep in mind that the next/second candlestick is most likely to be bearish, about to become a shooting star or a bearish pin bar candlestick.

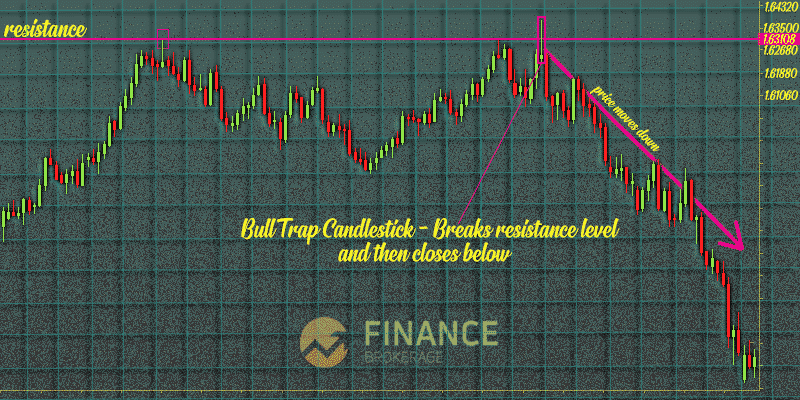
Pattern #2 – Bull Trap Trading
The second pattern we will focus on is when a candlestick breaks out the resistance level and goes up yet eventually close below the resistance level to form a bearish candlestick. It is the scenario where a bull trap candlestick shoots up and then heads downward. Thus, forming a bearish candlestick and maybe a bullish candlestick with bearish momentum.
- The price is to break through the resistance level like its real upward breakout trend causes the buyers to jump in.
- The market changes direction heading downwards nearing under the resistance level.
- Breakout low of the bull trap candlesticks leading towards a lower price.
- Bull trap candlestick seeks for the situation of a shooting star or a pin bar candlesticks.
- Seek for a bearish candlestick whenever you’re in these scenarios or an extremely bearish yet bullish candlestick.

Pattern #3 – Bull trap Trading
Our last pattern to focus on is a bull trap candlestick breaks out resistance level, goes up yet near below the resistance level. In this pattern, the next one or two candlesticks are more likely a bearish one. In fact, the bull trap must be bullish. To be exact, it is a green candle pattern.
The thing is, it should be nearing the resistance level. Remember that a bullish candlestick that closes below the resistance level will cause a lot of bulls. Thus, the price will continue to go higher. Watch out for the first or second candlestick after it, if it’s a bearish candlestick there’s a high possibility that it is a bull trap.

Bull trap – extremely high risk
Trading a bull trap – can be extremely risky for an individual investor or for the less-experienced traders. As we said at the beginning, advanced traders often benefit from trapped traders. One can buy securities at a low price only to find them declined overnight. It can be really challenging to identify the real price reversals from the bull traps.
Here, an extremely meaningful signal can be trading volume. If stock is reversing in price but still has low trade volume, or/and if the price suddenly breaks above the moving average it means that you are most probably dealing with the bull trap scenario.
Also, less-experienced traders must not try to time the market, rather focus on long positions.
Another good piece of advice on avoiding bull traps is to monitor support and resistance levels and avoid buying at resistance levels.
Along with this traders must be able to distinguish between bear trap and bull trap.
Last but not least: by understanding what bull traps mean and identifying them on candlestick patterns, one can not only avoid unnecessary risk but also trade with a gain.
-
Support
-
Platform
-
Spread
-
Trading Instrument

