Bitcoin, Ethereum, Dogecoin modest price recovery
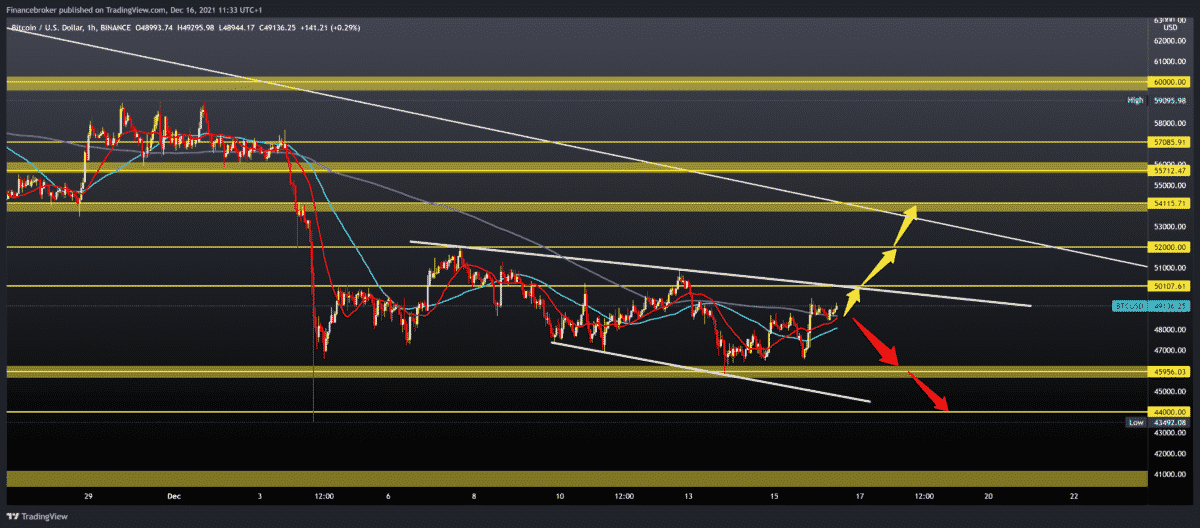
Following the Bitcoin chart on the hourly time frame, we see that the price is slowly advancing. She found support at $ 49,000, and with the help of moving averages, she could move on to $ 50,000. We can see on the chart how the Flag pattern was formed, and based on it, and we expect the bullish impulse to continue. In the $ 50,000 zone, additional resistance is created by the upper resistance line, and a potential break above would boost bullish optimism on the chart.
Bullish scenario:
- We need to continue this positive consolidation and test the line of resistance.
- The break above can take us to the previous high of $ 51,000.
- Our next potential resistance is at a $ 52,000 two-weeks high, and above it, the next resistance zone is around $ 54,000.
Bearish scenario:
- We need negative consolidation and price withdrawal below moving averages and $ 48,000.
- Further price withdrawals will lower us to the previous support zone of about $ 47,000.
- If it doesn’t hold up, we’ll move on to the next potential support in the $ 44,000 zone.

Ethereum chart analysis
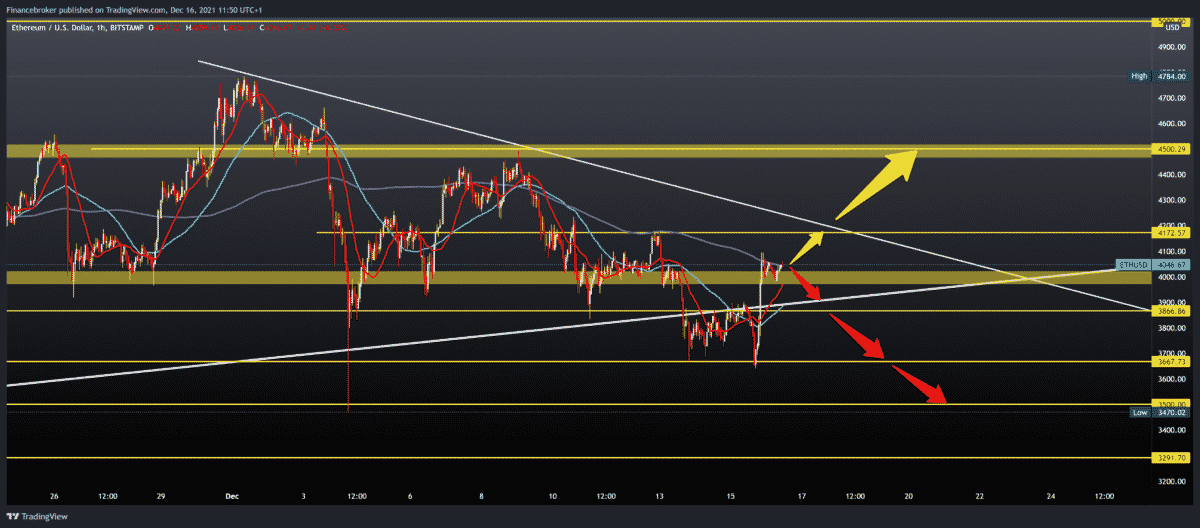
The price of Ethereum yesterday jumped from $ 3650 to $ 4100 within a couple of hours. Now ETH is consolidating just over $ 4,000. We have support in MA20 and MA50 moving averages, and we are looking for it in MA200 moving averages. Only if we make a break above MA200 can we expect further price recovery and the formation of new higher highs on the chart.
Bullish scenario:
- We need continued consolidation above MA200 and $ 4100 yesterday’s high.
- After that, we can expect to continue further towards $ 4172.
- This is where we meet the upper resistance line, and it can be a big obstacle if we don’t break above.
- If we make a break above, we have free territory up to $ 4,500, high from December 9th.
Bearish scenario:
- We need negative consolidation and pulling prices below moving averages and below $ 4,000 levels.
- Our first support is $ 3900 along the bottom trend line and MA20 and MA50 moving averages.
- If it doesn’t hold up, let’s move on to the next potential support in the $ 3670 zone.
- If bearish pressure continues to grow, the potential next support is the December low of $ 3470.

Dogecoin chart analysis
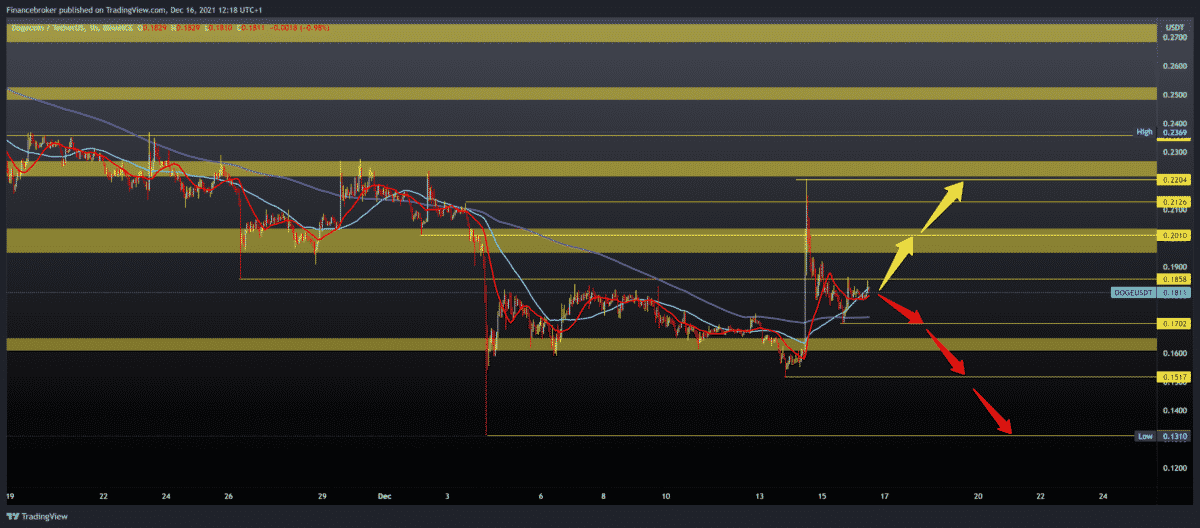
The price of Dogecoin jumped drastically after the tweet of Elon Musk that he would allow payment in Dogecoin for some Tesla goods. It is not specified which goods, but such news affected the value of Dogecoin. The price climbed to 0.22000 but quickly dropped below 0.20000, seeking support for a zone around 0.18000. With the current support of moving averages, we can expect a further recovery in prices and the formation of new December highs.
Bullish scenario:
- We need new positive consolidation and support at 0.18000.
- Additional support we have in MA20 and MA50 moving averages, and MA200 is in the zone around 0.17000.
- We are now looking at a break above the 0.18500 level to advance towards the 0.20000 area.
- Our next target is the previous high at 0.22000, and if we reach it, we will see the consolidation or wave of price movements.
- The December maximum is at 0.22350.
Bearish scenario:
- We need a negative consolidation and withdrawal of Dogecoin below the MA20 and MA50 moving averages.
- We then descend to the MA200 and test the support at 0.17000.
- If this support falters, we move to the next one at 0.15170 lower low from December 13th.

-
Support
-
Platform
-
Spread
-
Trading Instrument


