Bitcoin, Ethereum, Dogecoin daily chart view
Bitcoin chart analysis
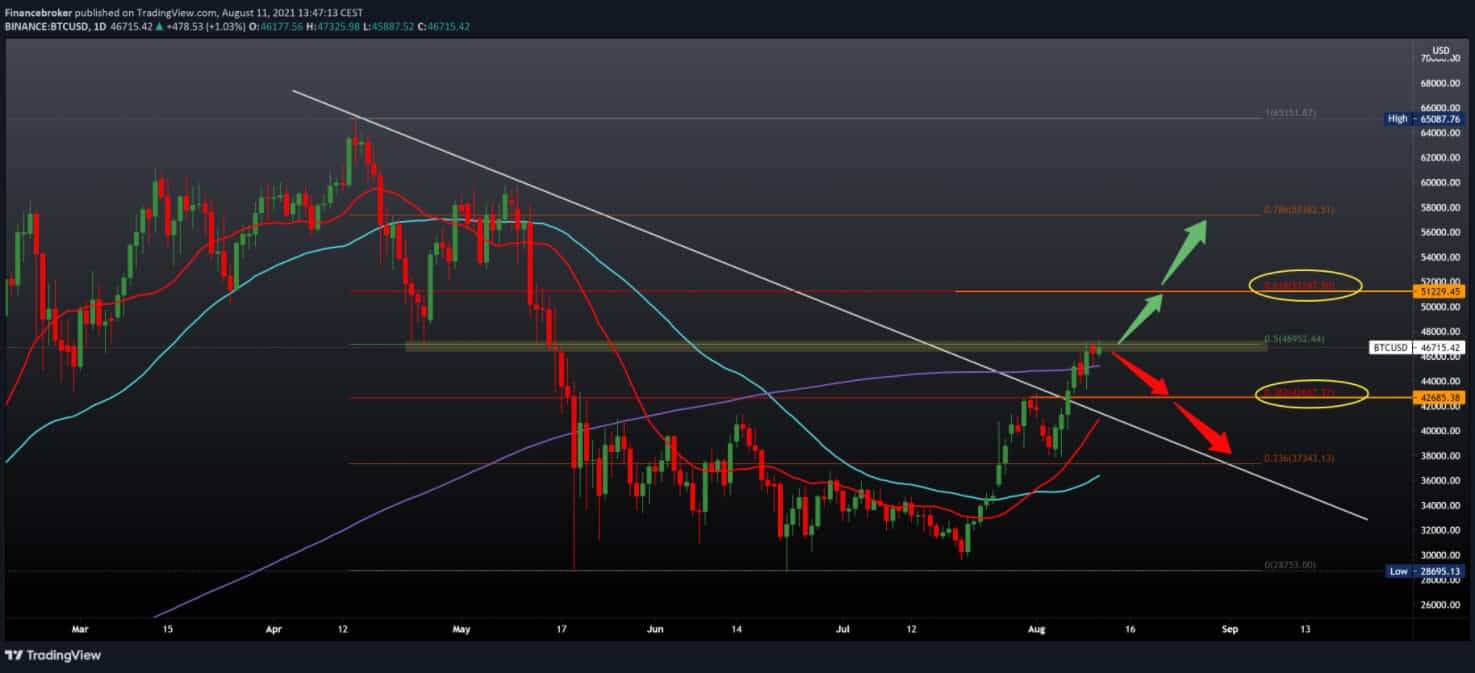
Looking at the Bitcoin chart on the daily time frame, the price is still testing the 50.0% Fibonacci level at $ 46,950. We are still in the bullish trend, and we can expect the price of Bitcoin to rise towards the next Fibonacci level to 61.8% at $ 51,230. We have good support in the 200-day moving average. For the bearish brand, we need a withdrawal below MA200; we seek price support at 38.2% Fibonacci level at $ 42657. After that, we find $ 40,000 psychological support and a 23.6% Fibonacci level at $ 37345. For now, we are moving to higher levels. Our first step is the zone around $ 48,000, and that is the place from April where the price then found support, but a month later, that support was missing, and we had a drastic drop in the price of Bitcoin.

Ethereum chart analysis
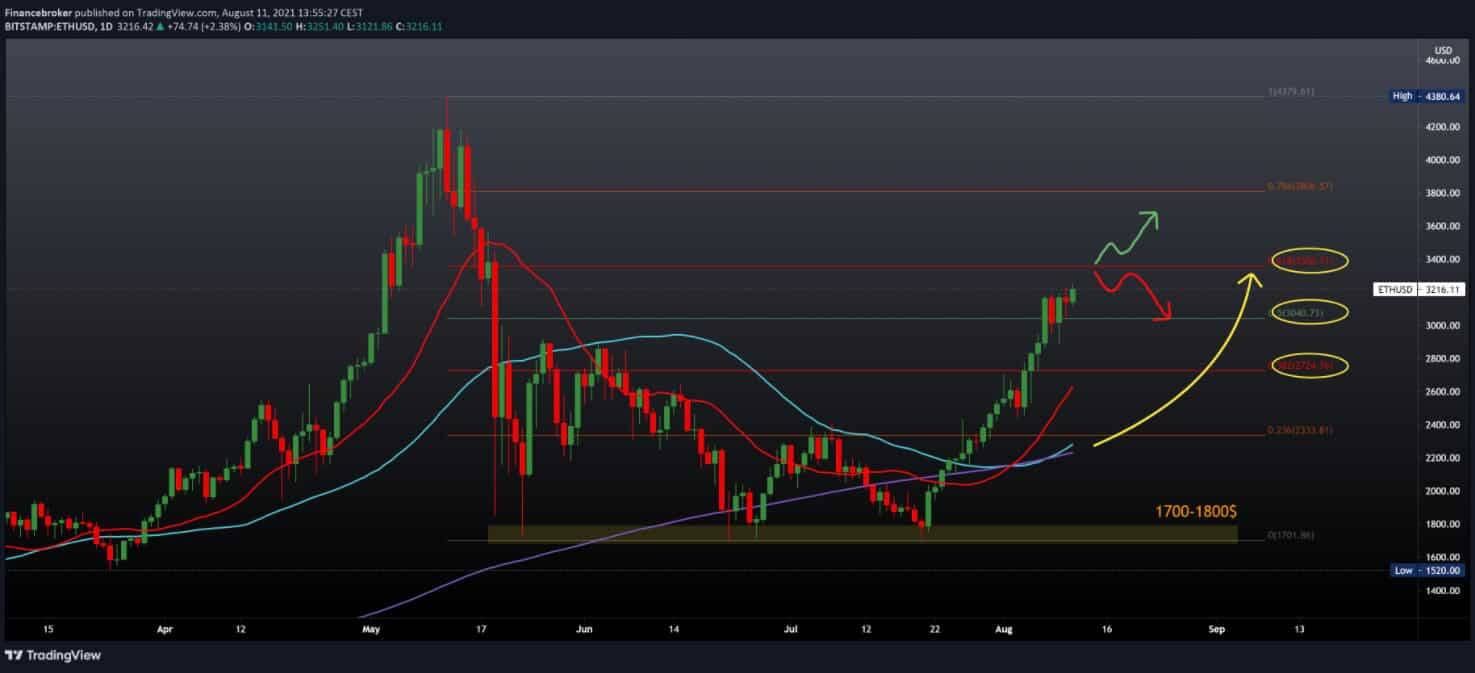
Looking at Ethereum ns the daily time frame, we see that the price is still in a bullish trend with the aim of seeing continued price growth towards higher levels on the chart. Our resistance is at 61.8% Fibonacci level at $ 3356, and our support is at 50.0% Fibonacci level at $ 3040. If there is a break above the 61.8% level, our next target is 78.6% Fibonacci level at $ 3800. If we expect the price to rise, we first need a drop below the 50.0% level, and then we seek support at the 20-day moving average with the support of 38.2% Fibonacci levels at $ 2725.

Dogecoin chart analysis
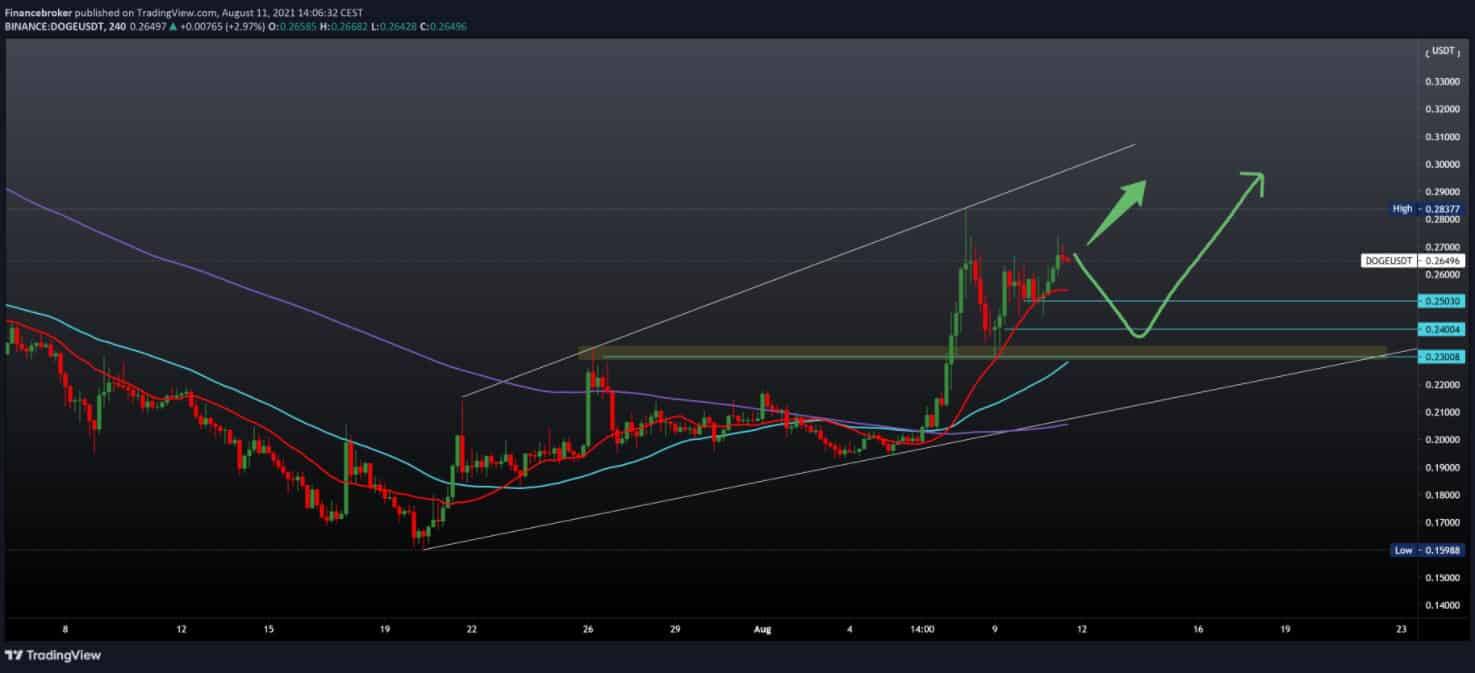
On the four-hour Dogecoin chart, we see that the price enters the critical zone at 0.27000, the place of previous resistance. If a withdrawal occurs, we seek support in the first zone around 0.25000, which coincides with the 20-day moving average. Below that, our next support is at 0.24000, the previous place of rejection, and a little lower we are waiting for the zone at 0.23000, the area of the last break up. We have restricted the movement with the upper and lower lines, forming one growing channel, and we can expect the price to move within these limits.

Market overview
Yesterday’s online analysis of the blockchain data firm Kaiko suggests that trade activity continues to shift from China to the US and the EU amid the crackdown on cryptocurrency mining in the communist state, CoinDesk reported.
Data from provider Glassnode show that the total supply of bitcoin held by entities with a balance of 0.1-1 BTC continued to grow along with the price of bitcoin, indicating that retail is being bought together with institutional investors.
Bitcoin is not the only crypto crisis whose jump in trading was recorded in August.
“Ether and other assets represent the majority in trading volume, not bitcoin,” said Daniel Kim, head of capital markets at Maple Finance. “This shows that individuals and institutions feel much more comfortable holding other cryptocurrencies and no longer” diversify “their portfolios just by holding bitcoin.”
Other significant altcoins in the top 20 by market capitalization also rose high over 24 hours with Cardan (ADA, + 18.9%), KSRP (+ 8.26%), coin binance, polygon (MATIC, + 9.82%), and star (KSLM, + 6.29%) with the highest gain.
The link between Bitcoin and Ethereum has grown, and indicators suggest that a bearish period is over for the best cryptocurrencies.
One of the key indicators signaling the end of the bearish period is the middle age invested in the dollar. This indicator measures the average duration of a dollar invested in Bitcoin and Ethereum at an address without any movement.
Sleep and lack of movement are considered negative signs of the price of crypto. Currently, the average age of the dollar has stopped growing for Bitcoin and Ethereum, which implies that BTC and ETH are inactive in investors’ wallets and are now on the move.
Indicators that predict price movements based on dormancy quantify the intentions of traders (to buy or sell). Similarly, Willie Woo, an independent Bitcoin analyst, quantified the supply shock at BTC and ETH to predict future price movements.
Voo presented several methods for calculating traders’ intentions by estimating an offer that is not available in relation to the available offer.
Voo explains the long-term shock supply of holders (LTHSS) as the movement of coins that did not move for a long time or were considered inaccessible. The indicator of the average age of the invested dollar currently suggests that both BTC and ETH are exposed to a long-term shock in the supply of holders, which is bullish for the price of cryptocurrencies.
-
Support
-
Platform
-
Spread
-
Trading Instrument


