


Bitcoin, Ethereum continue to consolidate
Bitcoin chart analysis
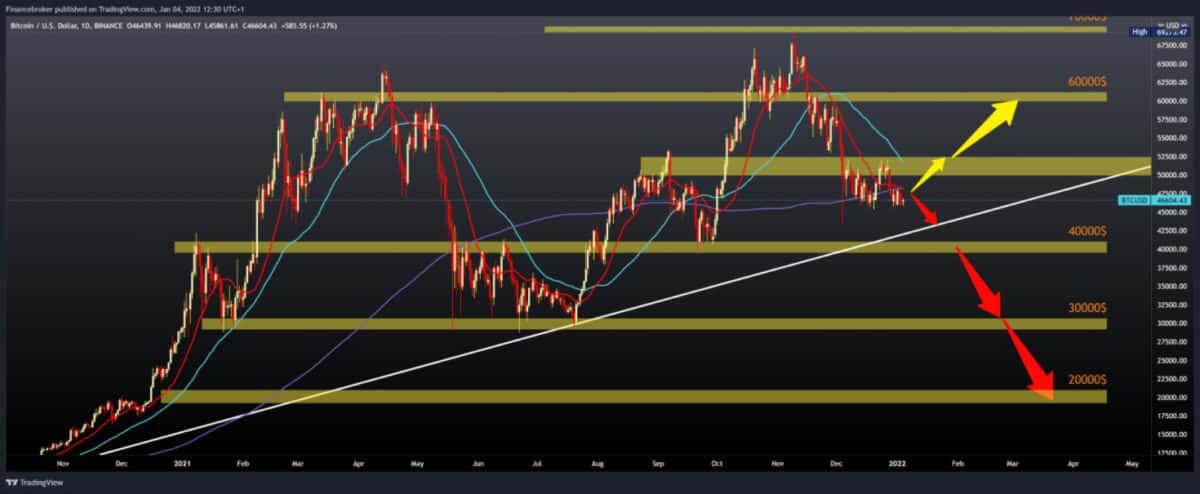
During the New Year holidays, the price of Bitcoin was calm, ranging from $ 45,000 to $ 48,000. Bearish pressure is still evident on the chart, the price is still below the MA200 daily moving average, and the additional pressure is boosting the MA20 moving average. We can expect bitcoin to drop to the lower trend support line based on this picture.
Bullish scenario:
- We need new positive consolidation and a return on prices above the MA20 and MA200 moving averages.
- We have to climb above $ 48,000 to try to endanger the $ 50,000-52,000 zone.
- In that zone, the additional resistance is in the MA50.
- Only a break above this zone can bring us back to a longer-term bullish trend.
Bearish scenario:
- We need to continue this negative consolidation and direct the price towards the lower trend support line.
- Then we seek support in the previous low zone at $ 44,000.
- Break below, the descent us further to support at $ 40,000, the last time we were there was in September last year.
- With further bearish pressure, prices are likely to continue until the next support at $ 30,000, the site of a major consolidation from May to August last year.

Ethereum chart analysis
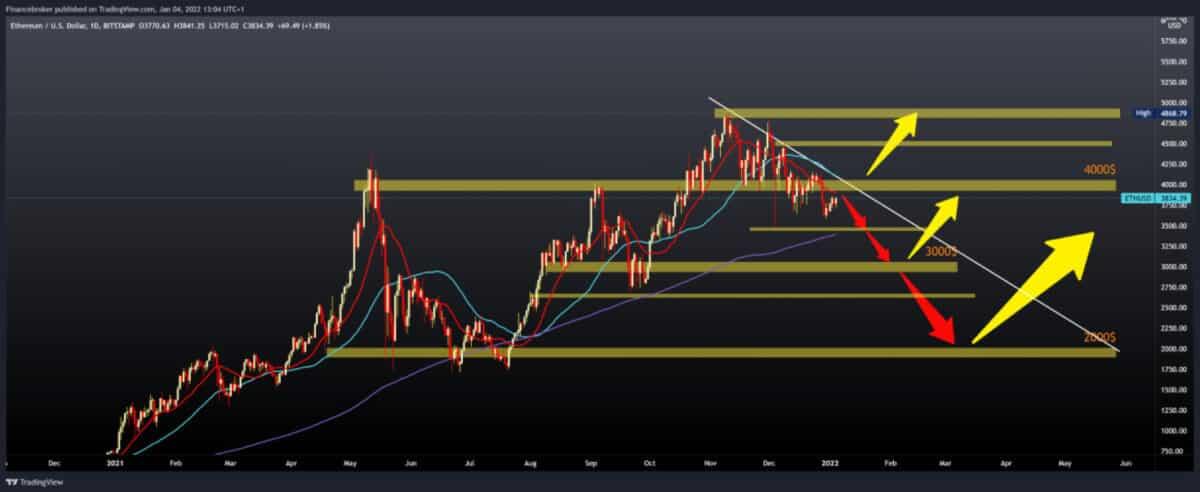
The price of Ethereum has been in positive consolidation since December 29, after finding the stage at $ 3600. The price is currently at $ 3835, and we will soon reach the MA20 daily moving average. If this trend continues, we can expect to climb to the upper trend line soon, determining further direction.
Bullish scenario:
- We need to continue positive consolidation and move above the MA20 daily moving average to test the upper trend line and potential resistance zone at $ 4000.
- If the price increases above, we can expect a further, stronger, and more serious bullish trend.
- Below, our first resistance is the previous high at $ 4500, and the next resistance at $ 4750.
Bearish scenario:
- We need negative consolidation and a return to the previous low of $ 3600.
- We go lower to the December low at $ 3470 and the MA200 moving average with further bearish pressure.
- Our next support is the psychological level at $ 3,000, then the low from October at $ 2,650.

Market overview
Bitcoin started quietly in 2022. With an annual gain of more than 60% in 2021, BTC has proven to be one of the financial assets with the best performance in global markets. However, digital assets have witnessed an actual increase in network activity.
Last year, the Bitcoin network broke several records, including the total number of wallets with non-zero balance and active BTC entities. So far in 2022, the digital currency has experienced a sharp decline in crucial network metrics and activity indicators.
Large Bitcoin addresses have begun to move crypto assets from stock exchanges and active wallets to silent wallets and inactive accounts. The volume of trading on the digital stock market has also dropped significantly over the last few days.
An active supply of BTC is an important indicator of the overall health of its network activities. Over the last 12 months, the active supply of bitcoin has increased significantly, and long-term owners have reduced their consumption. In some cases, large Bitcoin addresses have even accumulated digital assets. Long-term owners (LTH) have spent about 150,000 BTC since October, only 1.11% of their total hold. The slowdown in consumption is significant given the sharp and continuous correction during this period.
-
Support
-
Platform
-
Spread
-
Trading Instrument

