


Bitcoin, Ethereum, and Dogecoin – positive price movements
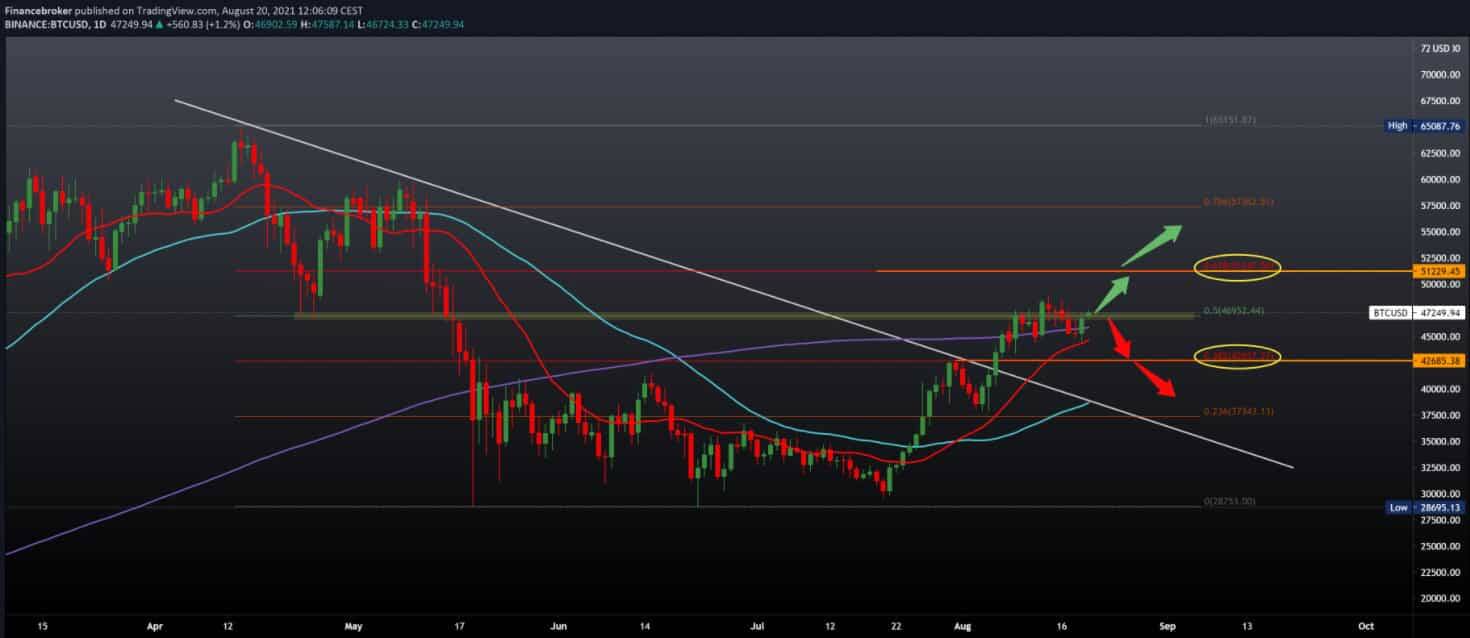
Bitcoin chart analysis
Looking at the Bitcoin chart on the daily time frame, we see that the price yesterday managed to return above the 200 daily moving average at the end of the day, and again we test the 50.0% Fibonacci level at $ 46,950. The price movement is still sideways in the zone 44000 -48000 $. To continue the bullish trend, we need further price growth above $ 48,000, and if Bitcoin manages to overcome that level, we can expect a further continuation to 61.8% Fibonacci level at $ 51,250. For the bearish scenario, we again need to raise the price below the 200-day moving average and the 20-day moving average to $ 45,000, and we are looking for support at a 38.2% Fibonacci level at $ 42,650.

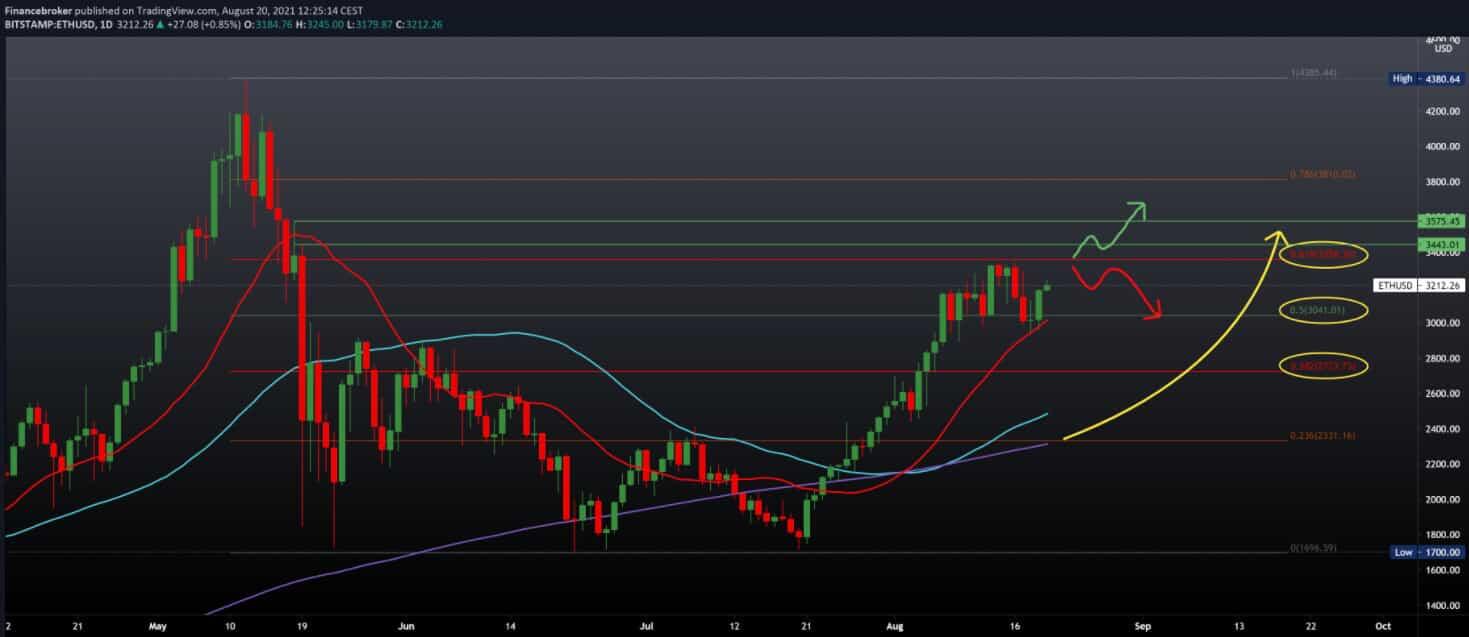
Ethereum chart analysis
Looking at the chart on the daily time frame, we see that the price has found support in the 20-day moving average and 50.0% Fibonacci level at $ 3040. We are now looking at whether the price will manage to break above 61.8% Fibonacci levels at $ 3358, or we will see another pullback. If the price manages to make a break, we climb to the next 78.6% Fibonacci level. Before that, we are likely to encounter some resistance at the next levels of $ 3445 and $ 3575. We need a withdrawal from the current position or above with 61.8% Fibonacci levels for the bearish scenario. Then again, we are looking for support at a 50.0% Fibonacci level and a 20-day moving average. A further break below them leads us to the next support zone at 38.2% Fibonacci level at $ 2723.

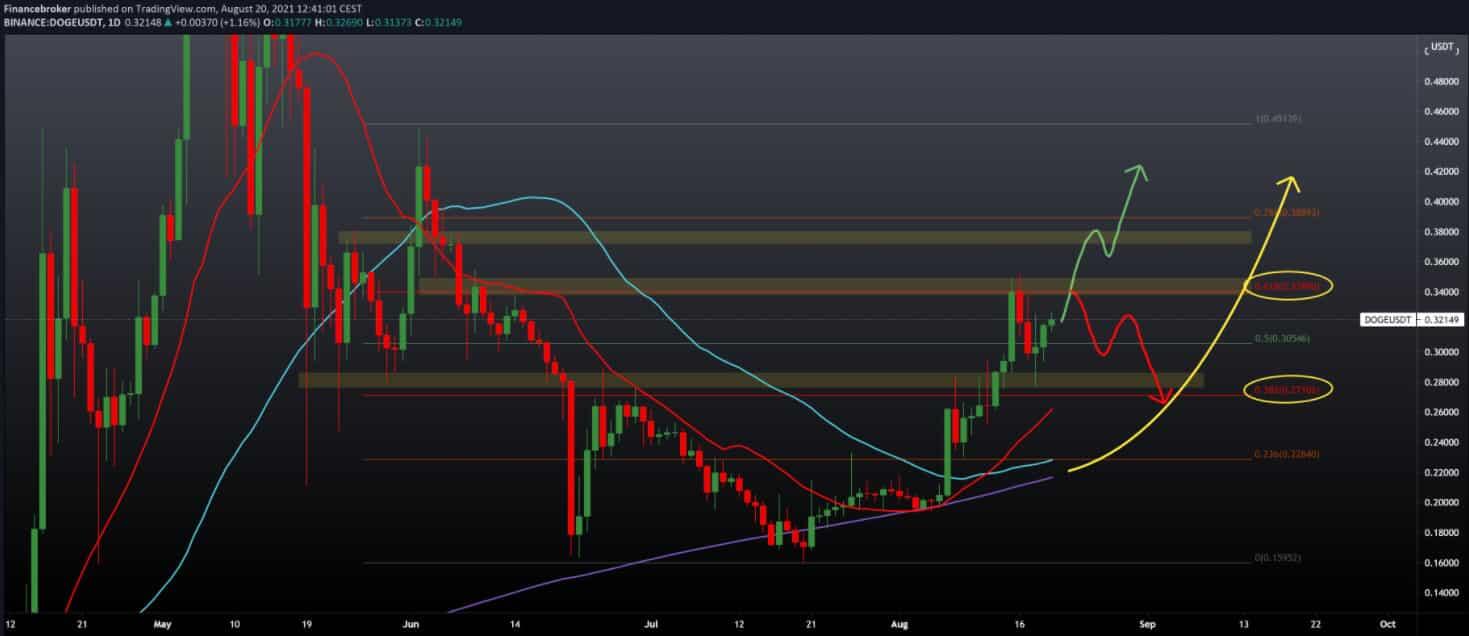
Dogecoin chart analysis
Looking at the chart on the daily time frame, we see that the chart may make a FLAG pattern and launch the price of Dogecoin to higher levels. For now, we have resistance at 61.8% Fibonacci level at 0.34000 and support at 50.0% Fibonacci level at 0.30550. To continue the bullish trend, we need to wait for the transition above 0.34000 in order to have a more specific bullish signal on the chart with the target at 0.38900. For the bearish trend, we need the price to fall again below 50.0% Fibonacci level, and then we look at the support in the zone at 38.2% Fibonacci level at 0.27100. Looking at moving averages, we can expect that if there is a pullback, we look for the first support in a 20-day moving average.

Market news
Wells Fargo, the oldest bank in the United States – has registered a new mutual investment fund that offers its rich clients indirect exposure to bitcoin (BTC).
Fargo’s submission of the “Securities Exemption Notice” – also known as Form D – to the United States Securities Commission reveals that the fund is called “FS NIDIG BITCOIN FUND I,” reflecting the fact that it is incorporated as a limited partnership. Company with the investment services company NIDIG and the alternative asset manager FS Investments.
The notice states that Wells Fargo Clearing Services will receive placement and servicing fees for all clients related to the fund. It also notes that the fund’s first sale has yet to happen and that Fargo expects the offer to last more than a year.
Fargo’s turn in cryptocurrency reflects the growing popularity of the property class on Wall Street, attracting Goldman Sachs, BNI Mellon, JPMorgan Chase, and Morgan Stanley.
This May, Darrel Cronk, president of the Wells Fargo Investment Institute, told reporters that the institution now estimates that the cryptocurrency space has “affected the evolution and maturation of its development that allows it to now be a sustainable investment asset” and has since started offering exposure to its customers with high net worth. Back in December 2020, the head of the real estate strategy at the institute suggested that there was not much interest in crypto.
-
Support
-
Platform
-
Spread
-
Trading Instrument

