


Bitcoin, Ethereum and continued price decline
Bitcoin chart analysis
The price of Bitcoin for the last 24 hours is calm and is consolidating in the range of $ 47,500-48,000. And now we must pay attention to the continuation of this consolidation. The price was at $ 52,000 two days ago, testing the MA200 moving average, but it very quickly started to fall to its current level. Now all moving averages are focused on the bearish side and facing the previous support zone of around $ 46,000.
Bullish scenario:
- We need a new positive consolidation that will redirect the price towards the previous resistance zone of $ 50,000-52,000.
- A jump in the price of Bitcoin above $ 50,000 would support the MA20 and MA50 moving averages.
- Then we test the $ 52,000 level and the MA200 moving average again.
- A further bullish impulse can take us to the next resistance zone at $ 54,000.
Bearish scenario:
- We need to continue this negative consolidation and test the previous support zone at $ 46,000.
- Break below this zone, lowering us to test the December low at $ 43,466.
- And if it doesn’t last, we go down to the $ 40,000 September Bitcoin price zone.

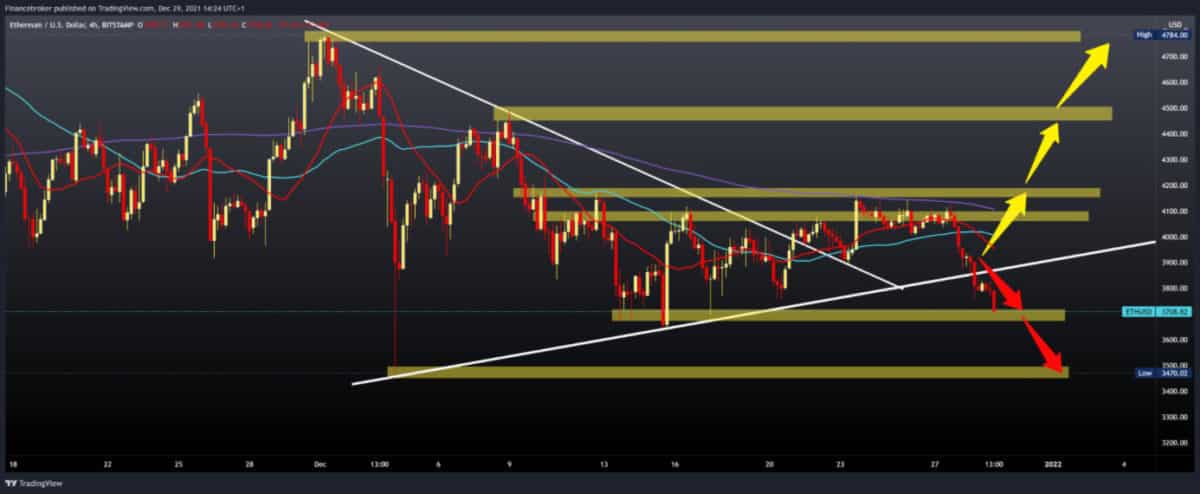
Ethereum chart analysis
The price of ETHUSD continues to withdraw today, currently testing the support zone at $ 3,700. It is possible that this is just a holiday sale and that we will see the price continue to rise after the new year. For now, the bearish pressure is evident in this time frame, and we can expect a further continuation of the bearish trend if the picture on the chart does not change.
Bullish scenario:
- We need a new positive consolidation and a return to the price above the trend line and $ 3900 level.
- Then at $ 4,000, we come across moving averages of MA20 and MA50, and the way they consolidate around them can tell us the next price movement.
- In the $ 4100 zone, additional resistance is our MA200 moving average, and a break above would boost bullish optimism for Ethereum’s further recovery.
- If we climbed to the $ 4,500 level, then we could say that the crisis on the chart is over, and we are returning to the bullish trend.
Bearish scenario:
- We need to continue this negative consolidation and a break below the $ 3,700 support zone.
- Our next set of support is the December minimum at $ 3,470.
- If bearish pressure continues on that level, then we can expect further continuation on the lower levels on the chart and return to the October movement zone.

Market news
Crypto suffered a drop in markets early Tuesday, resulting in about $ 300 million in liquidating a number of crypto futures contracts. According to an on-chain analysis, over 109,000 trader positions were liquidated in the last day, and while bitcoin values rose above $ 52,000 on Monday, about $ 4,000 fell on Tuesday. Tone Vays, an experienced trader and analyst, believes that the current market action is just noise and predicts significant growth in Bitcoin. Ways tells his subscribers in the new strategy session that bitcoin has been bullish since it recovered from the fall caused by the pandemic in March 2020.
Mining in Thailand
Retail mining of cryptocurrencies in Thailand has an incentive. Due to the capitulation of Chinese miners caused by the new mega ban on cryptocurrencies in the country from September. Thailand entrepreneurs and crypto companies are increasingly capitalizing on Chinese miners getting rid of their cryptocurrency mining machines. Thailand is not the only country whose development of crypto mining has benefited from the release of Chinese cryptocurrency miners. The United States, Kazakhstan, and Russia have experienced a huge influx of new cryptocurrency mining operations.
-
Support
-
Platform
-
Spread
-
Trading Instrument

