


Bitcoin and Etherium record new declines this year
Bitcoin chart analysis
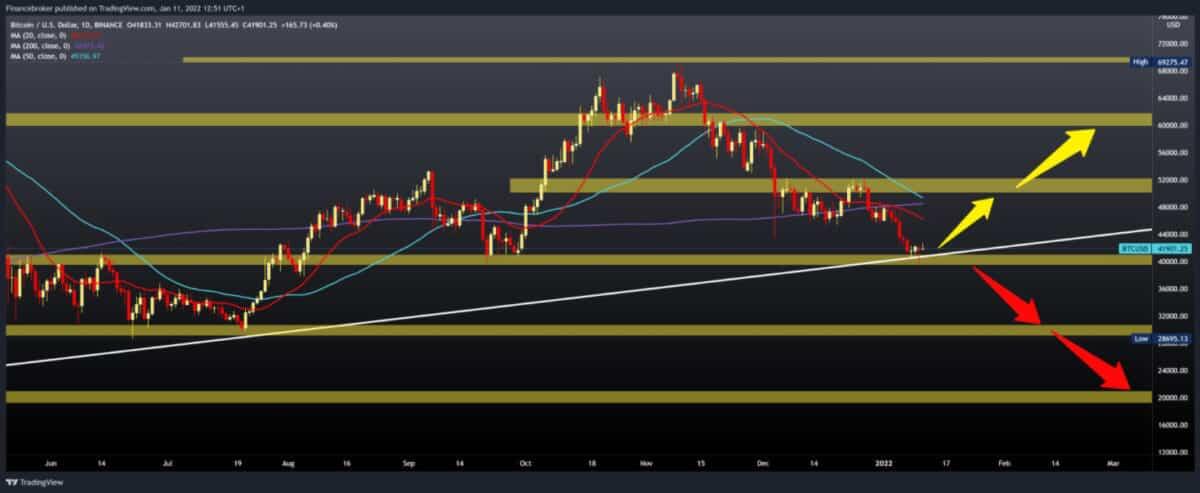
The price of Bitcoin yesterday broke support to $ 40,000, dropping to $ 39,672. Bitcoin is still under a lot of bearish pressure, with targets below $ 40,000. It is now priced at $ 41,900 and seeks support to end the current bearish situation. Global financial markets, stocks, and cryptocurrencies hit on January 10 after rumors circulated that the Federal Reserve could raise interest rates fourfold in 2022, trigger a sell-off, and send a reference 10-year short-term yield to above 1.8 percent. A massive wave of sales broke support for bitcoin (BTC) close to $ 42,000, resulting in a drop to $ 39,660 before buyers stepped in to buy the spotted decline. A change in the Fed’s monetary policy poses significant challenges for risky assets, but this was expected by Delphi Digital analysts, who noted that the troubles facing BTC and the crypto market have more to do with “tighter liquidity conditions and increased market volatility” than with increasing rates.
China will allow foreign visitors worldwide to use their digital yuan for the first time at next month’s Winter Olympics, the Central People’s Bank of China (PBoC) has confirmed. Bloomberg reported that visitors would be able to download a smartphone app or use a “physical card” – probably a version of the “hardware wallet” card that was tested in the country at an earlier stage of the digital yuan pilot.
Bullish scenario:
- We need a new positive consolidation and a new movement of prices towards the previous resistance zone.
- We need to climb to $ 48,000 to gain MA20 moving average support and escape the previous low of $ 39,672.
- In the $ 50,000-52,000 zone, we find resistance in the MA50 and MA200 moving averages, and a break above would boost bullish optimism.
Bearish scenario:
- We need continued negative consolidation below $ 40,000 and a lower trend line of support.
- Then an empty space opens up for us until the next support in the zone around $ 30,000, and we were there for the last time in July last year.

Ethereum chart analysis
The price of Ethereum fell below the $ 3,000 level yesterday, stopping at $ 2,930. Today the price has recovered, climbing to $ 3120 in an attempt to move from yesterday’s low. The bearish scenario is still evident on the chart, and we may see a sequel in the coming period.
Bullish scenario:
- We need a new positive consolidation to move the price above $ 3,200.
- Then our next target is the $ 3400 level, where the M200 moving average awaits us.
- At that level, we can expect increased bearish pressure.
- The break above directs the price towards the upper trend line up to $ 3800.
Bearish scenario:
- We need a new break below $ 3000, and after that, we can expect a further price hike.
- The first lower support is in the $ 2700-2800 zone; then the next is around $ 2500.

-
Support
-
Platform
-
Spread
-
Trading Instrument

