Bitcoin and Ethereum are still in a bullish consolidation
Bitcoin chart analysis
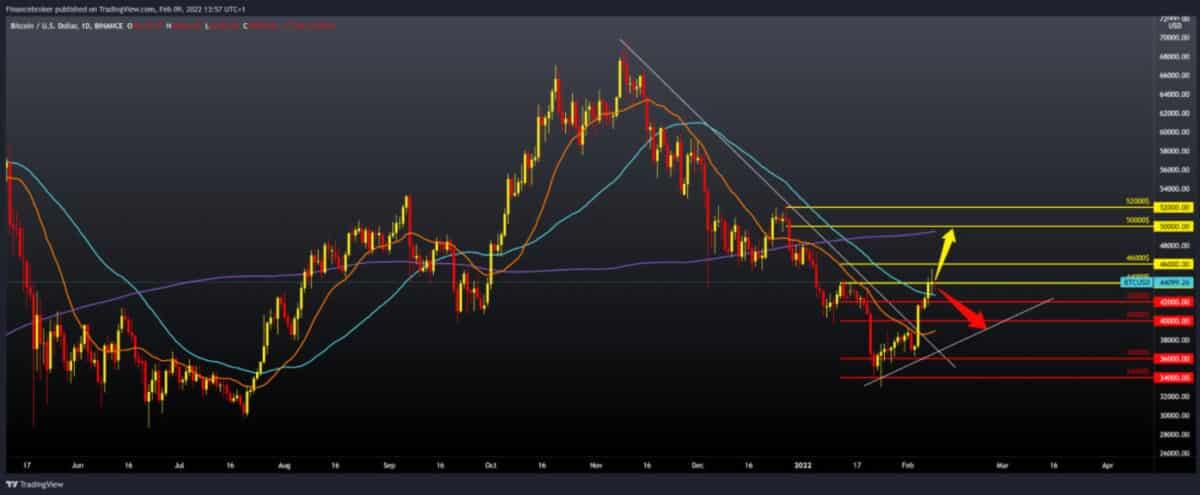
The global crypto market is in decline and seems to be slipping further after the recent growth. The change affected almost all major coins showing bear signs. Bitcoin is correcting gains and could fall further if it breaks $ 42,800 support. The price of Bitcoin is now trading above $ 42,500, and the current resistance is close to the level of $ 44,000. On the other hand, current support is at $ 43,000. The next key support is at $ 42,750. The range of $ 43,000 to $ 46,000 is very critical, and if bitcoin prices successfully break this level, then we could move to $ 50,000.
Bullish scenario:
- We need better positive consolidation and a stronger jump above the MA50 moving average.
- The price should test $ 44,000 again, and we have to make a break above, and our target is $ 46,000.
- If we follow the movement of moving averages, we have support for MA20 and MA50, and our target is MA200 at $ 50,000.
Bearish scenario:
- We need a new price withdrawal below $ 44,000 and below the MA50 moving average.
- The first support zone is $ 42,000 for us, and the next is $ 40,000.
- Until the price breaks the lower support line and makes a new lower low, we remain in the bullish trend.

Ethereum chart analysis
The price of ETH jumped on February 7, partly because KPMG, one of the world’s four accounting giants, announced that the company was adding Bitcoin and Ethereum to the balance sheet of its Canadian division. Anthony Pompliano, a partner at Pomp Investments, called KPMG’s move “very advanced,” noting that their participation would affect the confidence of their clients who may be considering adding crypto assets to their balance sheets. KPMG has long formed a section dedicated to cryptocurrencies and blockchain services in general. Her U.S. office is responsible for auditing software firm MicroStrategy Incorporated, which holds the world’s largest cryptocurrency position. Recently, KPMG Canada partner Kareem Sadek said the firm plans to strengthen its position in decentralized finance (DeFi), irreplaceable tokens (NFT), and the metaverse.
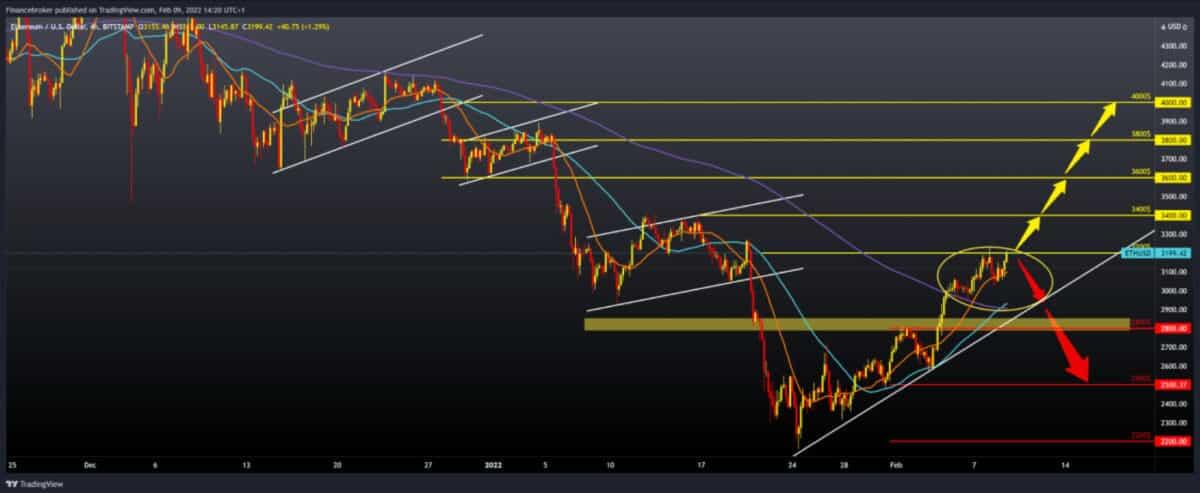
The price of Ethereum recently recorded its seventh 50% reduction in history in, as many have called, the new “crypto winter.” But the ETHUSD pair made up for half of their losses by climbing from a low of $ 2,150 to as much as $ 3,234 in less than three weeks.
Bullish scenario:
- We need to continue the current positive consolidation and break prices above $ 3,200.
- If the price succeeds, we can expect the next resistance at $ 3400, high in January.
- Pair has support in moving averages, and everyone is turning to the upper targets.
- The next potential resistances are at $ 3,800, then the psychological level at $ 4,000.
Bearish scenario:
- We need a new negative consolidation and a price withdrawal from the current high of $ 3,200.
- Our first lower support is at $ 3100, with additional support in the MA20 moving average.
- We can expect a larger next support zone around $ 2,900, where we have additional support in the MA50 and MA200 moving averages.
- At the bottom, we can draw one trend line that can help us technically track the price of ETH.
- A break below it could increase bearish pressure and lower us to the previous low of $ 2,200.

-
Support
-
Platform
-
Spread
-
Trading Instrument


