Bitcoin and Ethereum are testing support again
Bitcoin chart analysis
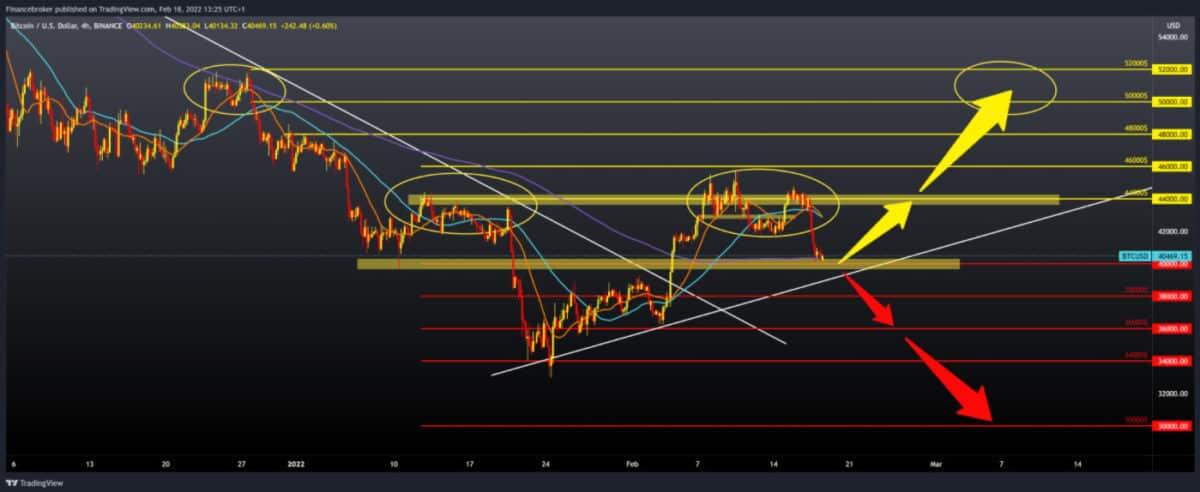
The price of Bitcoin continues yesterday’s withdrawal from $ 44,000 to the current $ 40,000. Now we hope to find support here and end this decline. $ 38,000 could be the next stop if the current downward move continues, but the same faith lies in the fact that $ 32,000 is the definitive threshold. Due to macro pressures, BTCUSD experienced a moderate sell-off on February 17, which continued on Friday, with a local low of $ 40,330.
Bullish scenario:
- We need positive consolidation from the current level of $ 40,000.
- After that, we climb again to $ 42,000, the previous support zone.
- The price must also break above the MA20 and MA50 moving averages to move further towards $ 44,000.
- In the future, the price could climb to the next resistance zone at $ 46,000, then $ 48,000.
- The main zone of this new bullish impulse would be the $ 50,000-52,000 zone.
Bearish scenario:
- We need to continue this negative consolidation and pull the price below the bottom line and test the $ 38,000 level.
- A break below would bring us down to the February low of $ 36,000.
- Our main bearish target is this year’s low zone of around $ 34,000.
- And if the sell-off continues due to geopolitical events, then we will see Bitcoin at $ 30,000, and maybe lower.

The number of users on the Bitcoin network continues to grow. The director of Global Macro posted a series of tweets late Thursday, focusing on the growth of the Bitcoin network since its inception as a decentralized exchange medium. In doing so, he compared the network effect of cryptocurrency to the effect of Apple, a trillion-dollar technology giant.
“Apple’s price has risen 1,457 times since 1996, while its price-to-sales ratio has risen 30 times,” Timer wrote, adding:
Suppose the valuation growth is an exponent of sales growth (according to Metcalfe’s law). In that case, the price should grow as an exponent of both metrics, and the application of the same metrics on the Bitcoin network has returned impressive growth.
Ethereum chart analysis
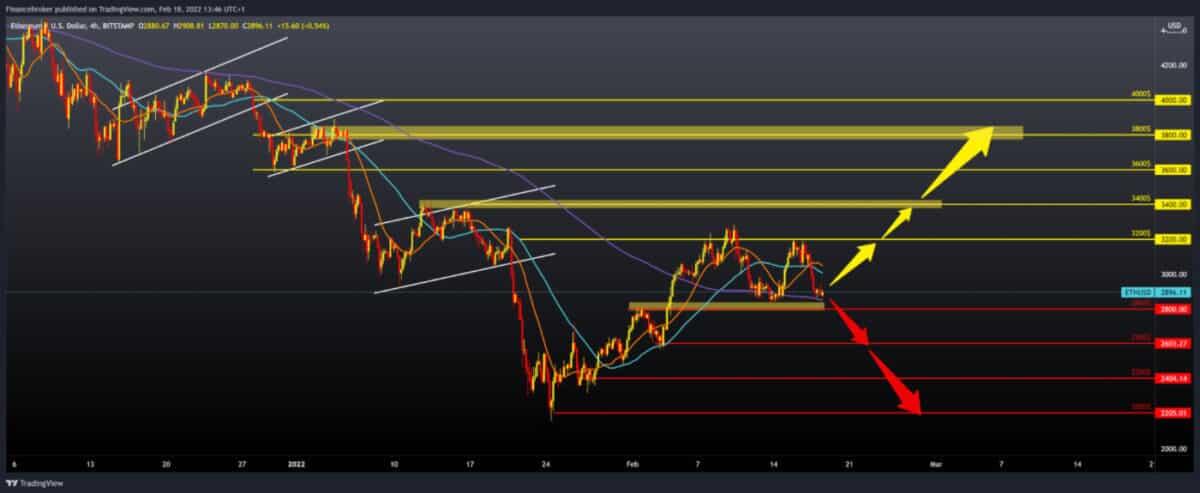
Same as Bitcoin, the price of Ethereum is retreating from yesterday’s high of $ 3,200. We are now at $ 2,900 and have current support in the MA200 running average. Now we have to pay attention to how the price will move because if we see a break below, then we can expect a further pull of the price towards lower levels of support.
Bullish scenario:
- We need a new positive consolidation and a return on prices above $ 3,000, and after that, we get support in the MA20 and MA50 moving averages.
- After that, we return to the zone around $ 3,200, where we expect new potential resistance.
- A break above us could lead to the next resistance at $ 3,400.
- In the continuation of that bullish impulse, our next potential zones of resistance are $ 3,600, $ 3,800, and $ 4,000.
Bearish scenario:
- We need negative consolidation and a price withdrawal below the MA200 moving average and below $ 2,800.
- Our first support is at the $ 2,600 February minimum, and the next at the $ 2,400, then the $ 2,200 January minimum.

-
Support
-
Platform
-
Spread
-
Trading Instrument


