Bitcoin and Ethereum: A new decline in the price of Bitcoin
- The first part of this week was ideal for the price of Bitcoin as we saw a jump from $16850 to $18370.
- The price of Ethereum was trying to hold above the $1260 level yesterday.
Bitcoin chart analysis
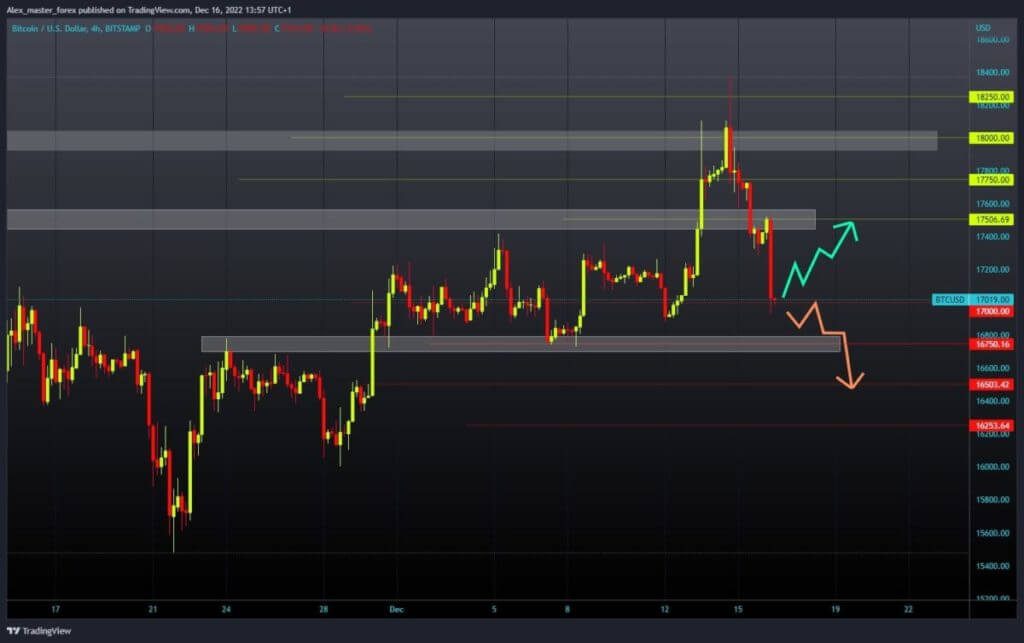
The first part of this week was ideal for the price of Bitcoin as we saw a jump from $16850 to $18370. In the second half, we see the top of the bullish trend and the reversal of the chart. The price of Bitcoin quickly retreated below $18000, which continued until today when Bitcoin fell to the $17000 level.
The current decline has been halted, but bearish pressure is still evident on the chart, and we could see a decline below the current support. We need a break below for something like that, and we would probably soon find it at $16750, the previous support level. The impossibility of the price to hold on to that place will lead to a further drop in the price. Potential lower targets are $16500 and $16250 levels.

Ethereum chart analysis
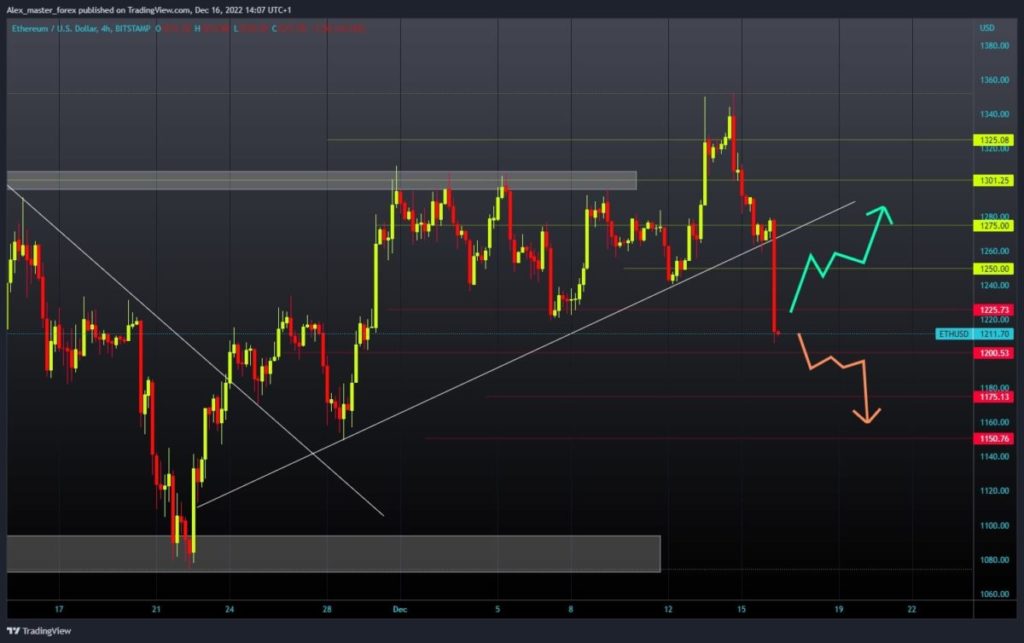
The price of Ethereum was trying to hold above the $1260 level yesterday. Early this morning, there was an increase in bearish pressure, and the price fell to the $1200 support zone. The price decline was stopped at the $1206 level, where we have a certain consolidation for now. We need a break below the support at the $1200 level for a bearish option.
If that were to happen, the price would form a new December low. Potential lower targets are the $1175 and $1150 levels. For a bullish option, we need to stabilize above $1225. After that, we could expect to see the start of a new recovery in the price of Ethereum. Potential higher targets are the $1250 and $1275 levels.


