


Bitcoin and Ethereum: Bitcoin is still around $22500
- On the Bitcoin chart, there is no change for the fourth day in a row, and the price movement range is $22400-$22700.
- A similar picture is on Ethereum’s chart; the consolidation from the weekend has continued.
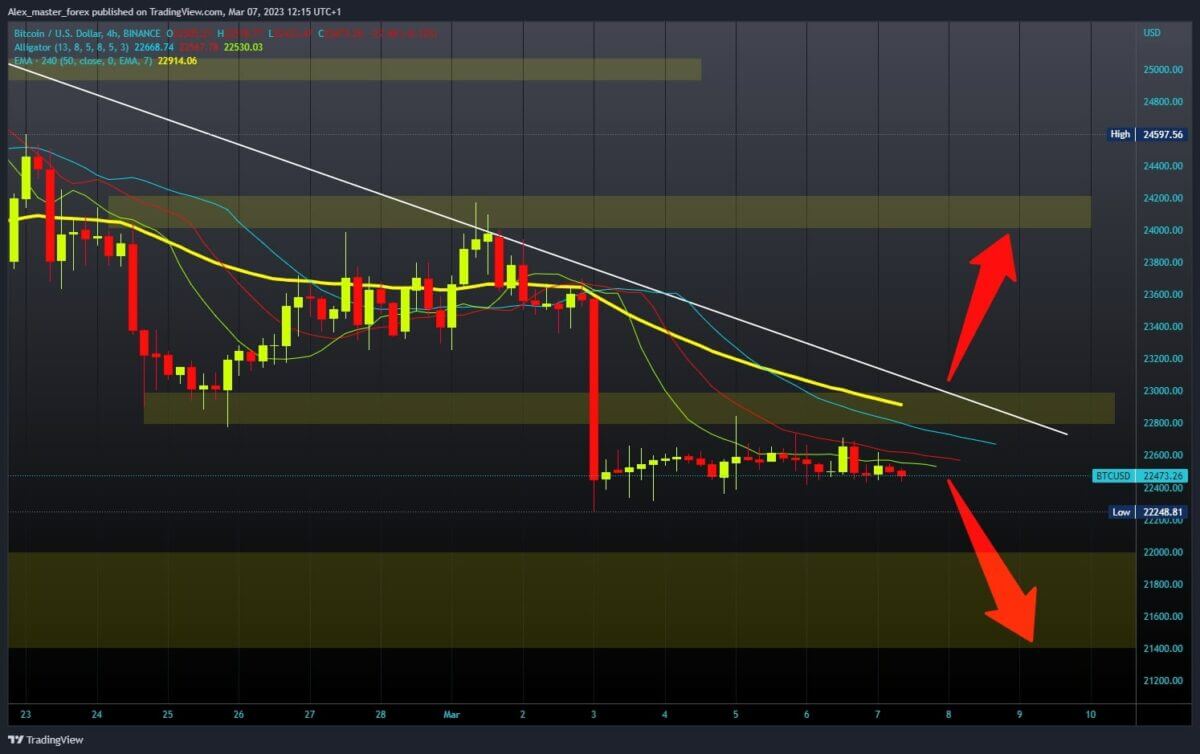
Bitcoin chart analysis
On the Bitcoin chart, there is no change for the fourth day in a row, and the price movement range is $22400-$22700. Bitcoin continues to hold above the March low at $22248. Price pressure is still evident, and there could be a move later during Fed Chairman Powell’s testimony. During his speech, we should expect increased price volatility on the chart. We need a drop to $22000 and a break below for a bearish option. After that, we could expect to see further weakening in the price of bitcoin. We need a positive consolidation and a break above the $22800 level for a bullish option. This would bring us significantly closer to the $23,000 level, which could result in a breakout above.

Ethereum chart analysis
A similar picture is on Ethereum’s chart; the consolidation from the weekend has continued. The price range is $1540-$1580. A drop below the $1,540 level would introduce uncertainty and trigger a further decline in the price to the next lower support. Potential lower targets are $1500 and $1475 levels. We need positive consolidation and a return to the zone around the $1580 level for a bullish option. This would bring us significantly closer to the $1,600 level. This could lead to a breakout above and trigger a price recovery. Potential higher targets are $1625 and $1650 levels.


