


What is a Bearish Piercing Pattern – Get The Information
As a motivated trader, have you thought about what the Bearish Piercing Pattern represents? Why is understanding that specific Pattern crucial for success in the market? And ultimately, how beneficial is it to use that particular Pattern?
First of all, for anyone who wants to achieve serious results in the Forex market, currently the largest and most dynamic financial market in the world, it is very important to know all the usage patterns, tricks, and strategies that can help him in this.
Namely, the Bearish Piercing Pattern is something you should master to increase your chances of making more significant profits. Let’s find out the piercing definition and what this Pattern represents, shall we?
The Bearish Piercing Pattern – Definition and Explanation
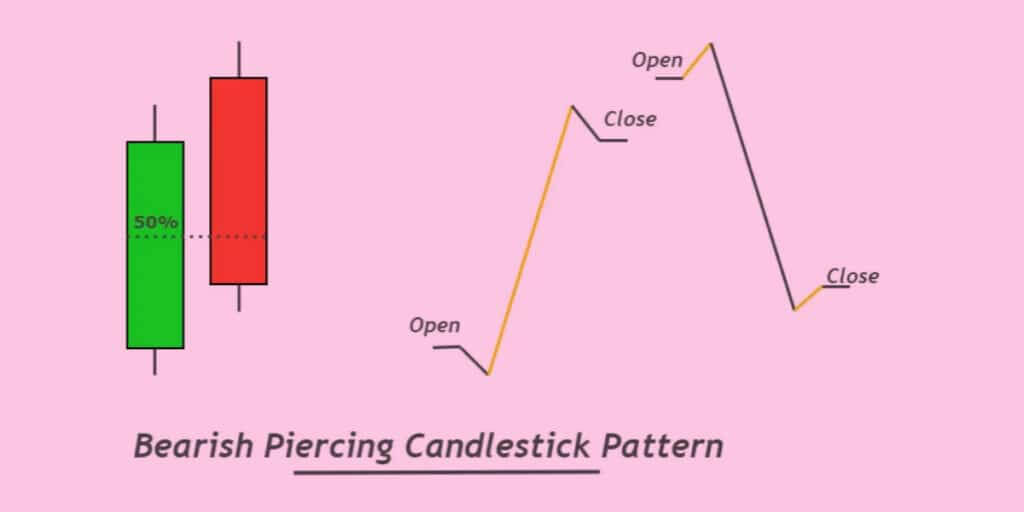
The Bearish Piercing Pattern represents a two-day reversal pattern, or a bearish trend reversal pattern on the daily chart from a downtrend to a strong bullish trend, and the opposite. The bearish candlestick in this particular Pattern is expected to close lower than 50% of the past bullish candlestick.
The opposite of the Bearish Piercing Pattern Candlestick is the Bullish Piercing Pattern that’s established mostly in indices and stocks, exchanged at the highest price level on the chart.
What are Piecing Patterns usually like?
Piercing patterns usually consist of 2 opposite color candlesticks, including a price intermission. People consider it a pattern showing a considerable gap between the closing price of the first day and the opening price of the second day.
How to best identify the Bearish Piercing Pattern?
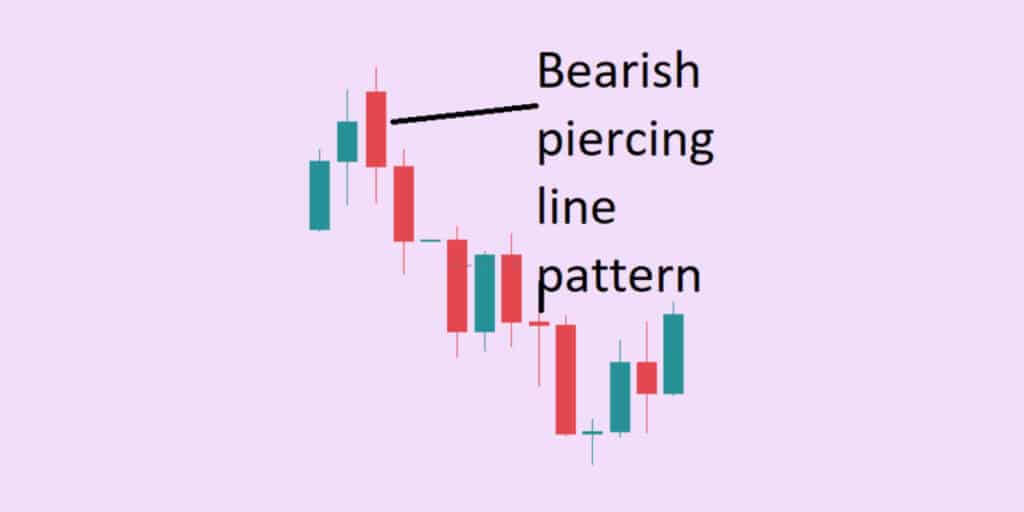
Identifying the Bearish Piercing Pattern can be a challenging task. However, if you know its characteristics, it will be fine to spot and identify it.
The Bearish Piercing Candlestick Pattern, such as the Bullish Pattern, mixes a usual sequence in order to create a Piercing Pattern.
Rules for identifying the Bearish Piercing Candlestick Pattern
To effectively spot a valuable piercing pattern on the price charts, we advise you to follow these rules:
- The proportion of the body to the wick of both bullish and bearish candlesticks should surpass 60%.
- The candlestick’s body represents the strength of market participants, buyers, and sellers.
- Following a bullish candlestick formation, a bearish one should open higher and end underneath the midpoint of the previous bearish candlestick. This Pattern should occur at the peak of an uptrend.
Additionally, it is vital to note that this is just one aspect to consider when analyzing market trends and should be used in conjunction with other technical indicators.
Understanding the Bearish Piercing Pattern

Suppose you’re eager to go deeper into the Bearish Candlestick Piercing Pattern topic. In that case, it’s crucial to understand that sellers must become more vigorous following a long uptrend compared to buyers. So, the price is expected to decrease. Here’s the reading of that price:
As buyers tend to weaken over some period, a bullish trend leading up to the formation of a candlestick pattern could indicate an impending price decrease due to an overbought market. Institutional traders may attempt to take advantage of this by creating an incorrect breakout through a gap at key levels in order to prevent retail traders from profiting.
Following the gap, a bearish candlestick closes within the essential level and under 50% of the prior bullish pattern. It would signal a disloyal breakout, as prices have dropped below resistance following the initial breakout.
A useful tip for professionals
It’s crucial to note that a false breakout is a fantastic signal of the price trend reversal. The emergence of a bearish piercing pattern at a key level of resistance can indicate a high likelihood of a successful trade.
What is the best place for a Piercing Pattern on the Price Chart?
The positioning of a candlestick formation on the graph is of utmost importance. Certain patterns are effective in trending markets, while others are better suited for sideways markets. To increase the chances of success, it’s wise to supplement your approach with additional indicators.
Here are three widely-used confluences that can enhance the probability of a profitable candlestick pattern:
- Resistance zone
- Overbought level
- Supply zone
Information Table of the Bearish Piercing
- Candlestick numbers: 2
- Prior Trend: Bullish Trend
- Prediction: Bearish Trend Reversal
- Counter Pattern: Bullish Piercing Pattern

How to effectively trade the Bearish Piercing Candlestick Pattern?
In order to effectively trade the Bearish Piercing Pattern Candlestick, it’s vital to understand the following trading strategy established by a supply zone and a Bearish Piercing Candlestick Pattern:
Begin with opening a sell order
It’s crucial to spot a strong supply zone on the chart. Once you have identified a supply zone, it’s vital to search for the piercing candlestick formation in it. You may expect the supply zone to mix with the technical tools’ candlestick pattern.
As a result, a strong bearish trend reversal signal will be established.
Stop-loss level:
Set stop loss greater than the big candlestick pattern in excess of the high candlestick pattern or the supply zone. Afterward, it’s vital to pick the high-level point without exception.
Take profit level:
It is recommended to exit 75% of the position when the trade reaches an even risk-reward ratio and to maintain the remaining trade until the potential gain surpasses the initial risk by a factor of 2.
Get to know more about the Piercing Pattern.

The Piercing Pattern represents a Bullish Reversal Pattern that usually appears at the conclusion of a downtrend. This formation is usually used as a signal to enter a long position or exit a short one.
It’s crucial to comprehend that the Piercing Pattern develops when buyers and sellers vie for control of prices. As mentioned above, it usually consists of two candlesticks. The first candle should be a large, bearish candle.
On the other hand, the second should be a bullish candle that closes above the middle of the first candle’s real body and also should be placed below the low of the previous candlestick.
A Marubozu candle – the formation of the Piercing Pattern
As the market trend is in a downward trajectory, the initial price is elevated. It continues to fall, forming a bearish candle at the close of the trading session. This bearish candle is typically a Marubozu, characterized by the lack of upper or lower shadows.
Subsequently, the opening price of the next candle dips beneath the prior bearish candle’s closing price. The buyers then enter the market, pushing for higher prices as purchasing activity increases. As a result, the closing price at the end of the day surpasses the median point of the previous bearish candle, indicating a shift in market direction.
The most suitable setup for this Pattern
Once a trader observes the famous piercing candlestick pattern on a stock chart, it is recommended to wait until the peak of the first candlestick is surpassed by the prior bearish candle.
This refers to an optimal trade opportunity when utilizing the Piercing Pattern.
The stop-loss should be set at the low point of the previous bearish candle. This specific Pattern is recommended for day and swing traders as the chances of success are relatively high in shorter time frames.
Remember that it’s also essential to corroborate the signals given by this Pattern with additional technical indicators. Traders are also able to utilize technical scans to filter out potential stocks for the next trading day, using a tool such as StockEdge App, now available on web platforms as well.
How is the Piercing Pattern best utilized?

When trading with the piercing Pattern, investors must pay attention to a few key characteristics:
- First and foremost, the market trend should be downward, as the Pattern signals a bullish reversal.
- The size of the candlestick plays a crucial role in determining the strength of the reversal.
- The distance between the bearish and bullish candlestick can indicate the potential magnitude of the trend reversal.
- Additionally, the bullish candlestick should close above the midpoint of the preceding bearish candle.
- Lastly, both the bearish and bullish candlesticks should have real substantial bodies.
Summary
The Bearish Piercing Candlestick Pattern represents a specific reversal signal that appears at the end of a downtrend. It is composed of two candlesticks, with the first one being a large bearish candle and the second one being a bullish candle that closes above the middle of the first candle’s real body and also below the low of the previous bearish candle.
This particular pattern indicates that the bulls are starting to gain control over the market and pushing the prices up. Traders are advised to search for this particular Pattern after a prolonged downtrend. The reason is that it provides a high probability of a successful trade.
To confirm the signal, traders can use other technical indicators, such as support and resistance levels. To maximize the chances of success, traders should set their stop loss at the low of the previous bearish candle. This Pattern is more suitable for day and swing traders as it works best in shorter time frames.
Traders can also use technical scans to filter out potential stocks for the next trading day using valuable trading tools in the market.

