


AUD/USD analysis for April 15, 2021
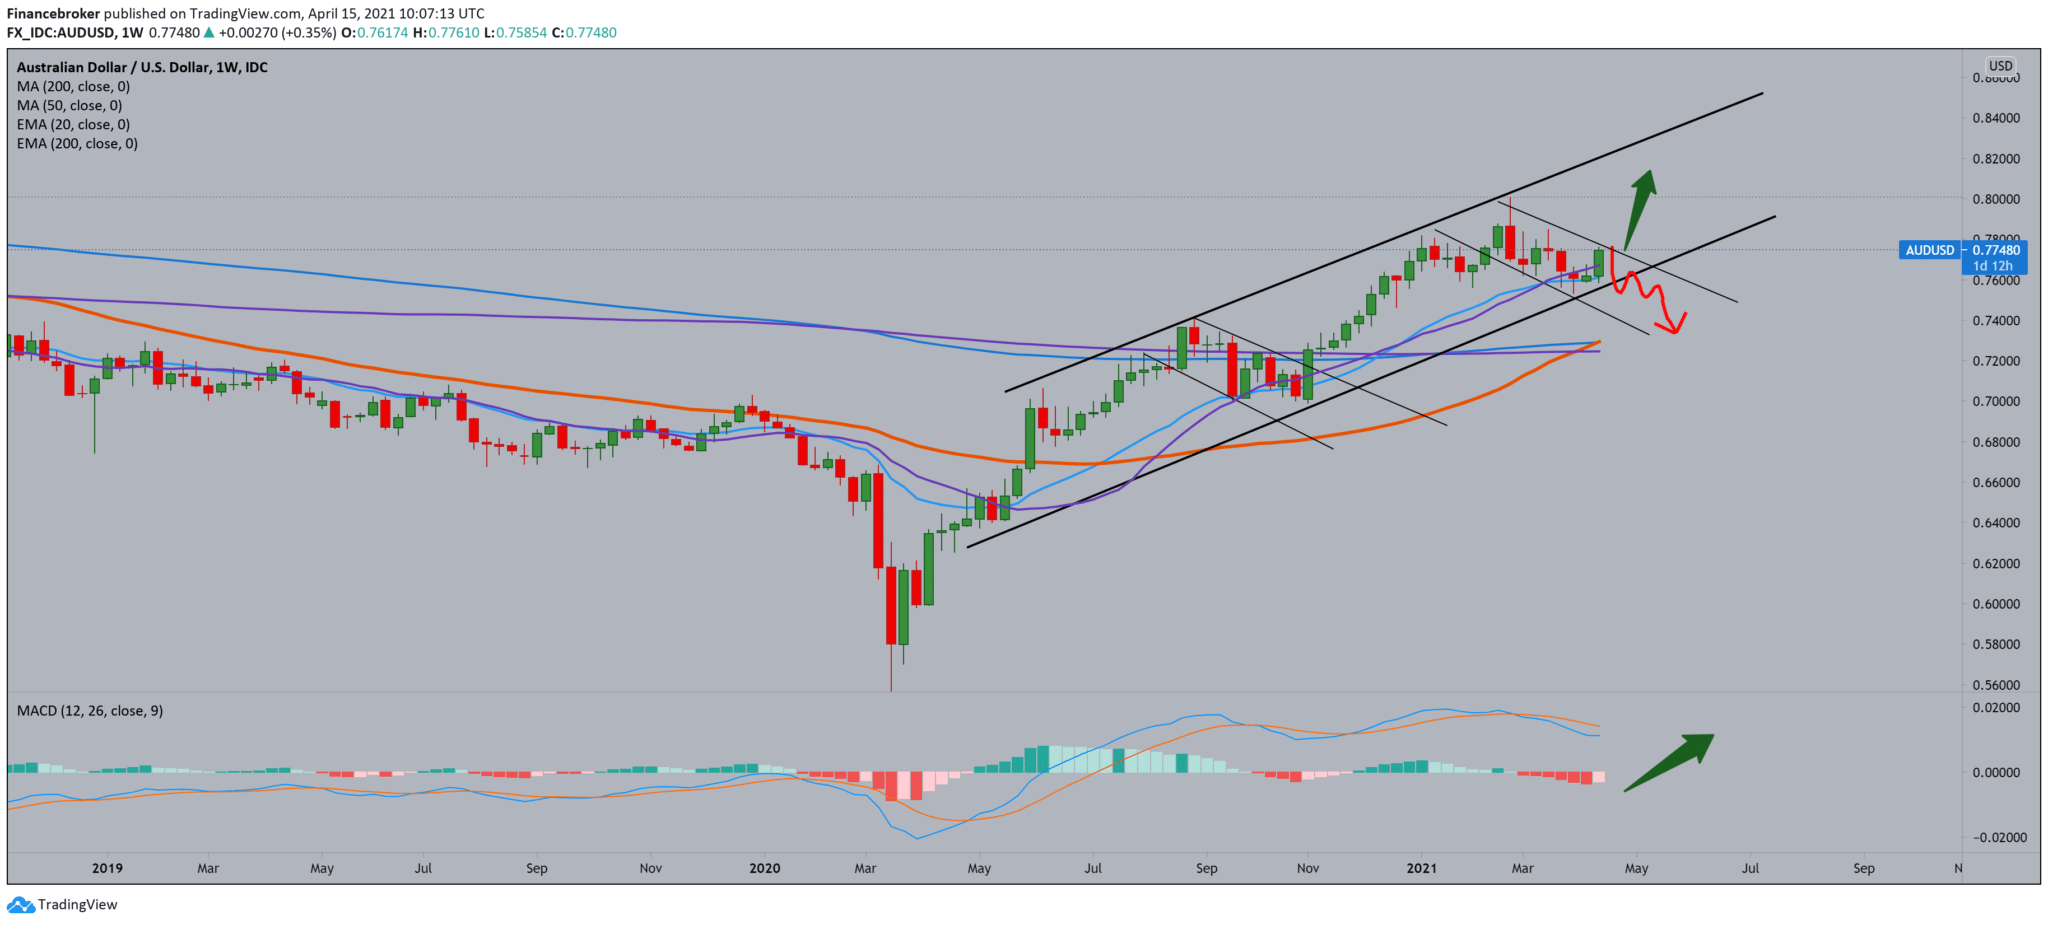
Looking at the chart on the weekly time frame, we see that the AUD/USD pair after support in the zone 0.75500-0.76000 bounces upwards, gaining the support of moving averages, crossing MA200 and EMA200 now we are looking towards the zone 0.78000-0.78500. As a goal, we can first set the previous high at 0.78500, and if we break that, our target is high at 0.80000. The MACD indicator is on the bullish side and based on that. We can expect a further continuation of the bullish trend. We can look for the bearish option if we see that the AUD/USD pair has weaknesses in the upper resistance zone.
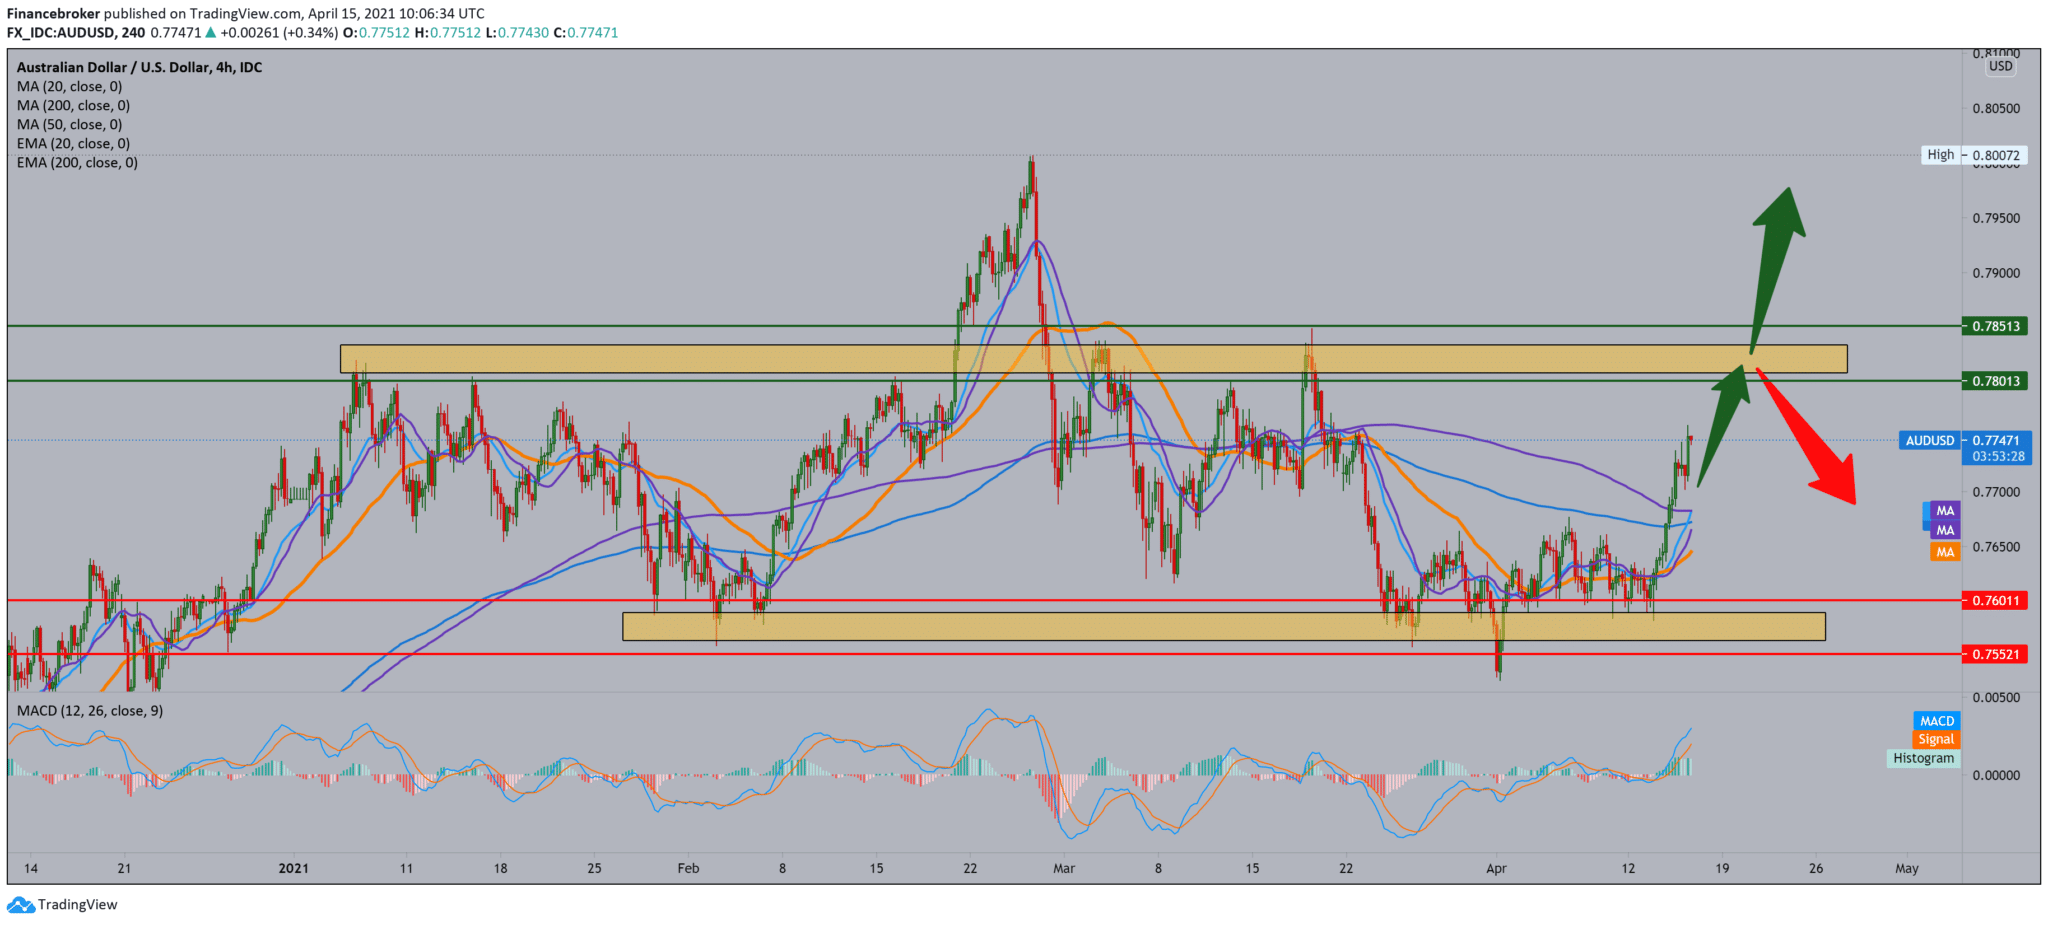
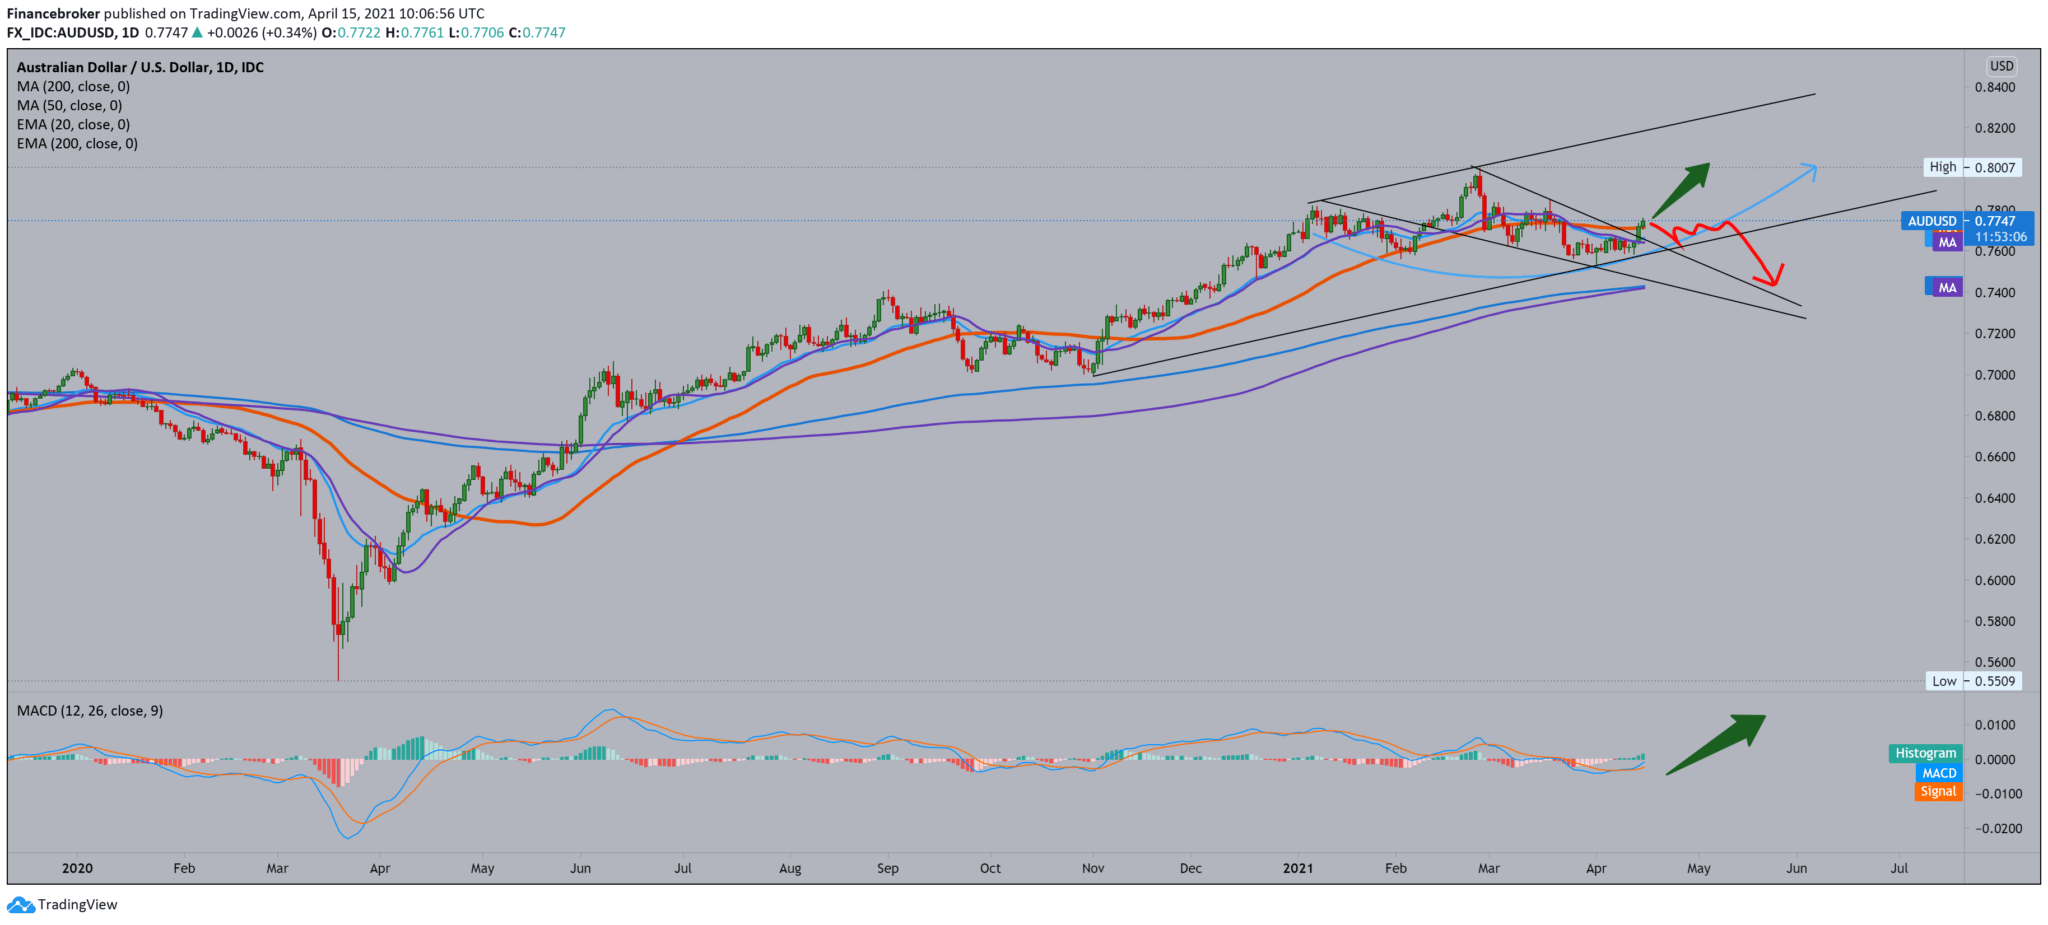
We see that the AUD/USD pair is still moving in a growing channel after this pullback on the daily time frame. After reaching a high at 0.80000, we see a drop to 0.75300 and a bounce back again in the bullish trend. We managed to go above the moving averages again, gaining significant support in the MA20 and EMA20. We can also be guided by the bottom line of the trend, which is an obstacle for us to move to a deeper bearish trend. Following the MACD indicator, we see that the signal is clearly bullish. The blue MACD line crossed the signal line directing the indicator to the green zone.
On the weekly time frame, we see a large rising channel, and as the AUD/USD pair, after touching the bottom line of the channel, bounces off, going above the moving averages of the MA20 and EMA20, which have been good support all last year. Within this channel, we can draw a smaller channel that frames the pullback. Now we need to see another green candlestick next week that will make a break outside that channel and strengthen our bullish option.
-
Support
-
Platform
-
Spread
-
Trading Instrument

