AUD/NZD forecast for February 26, 2021
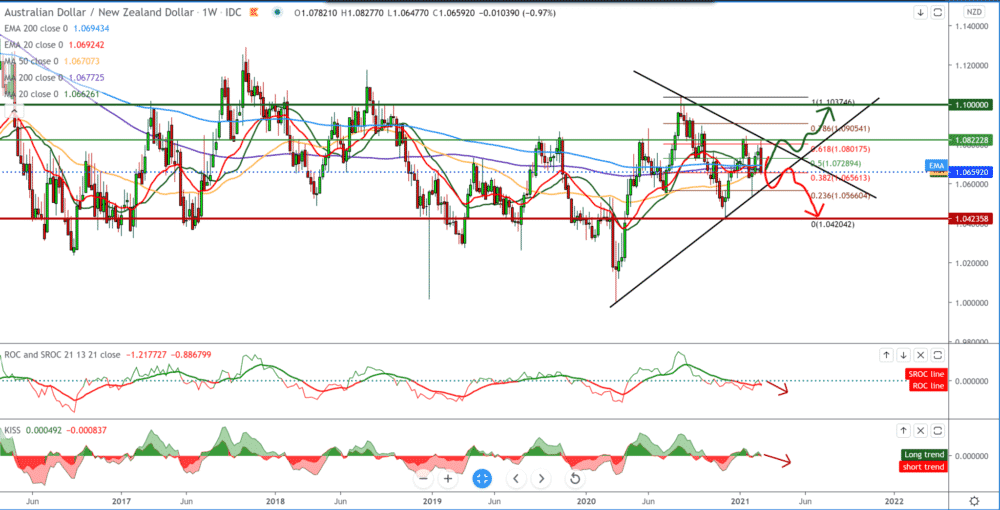
Looking at the graph on the weekly time frame, we see that a triangle has been formed on the graphically narrowing space for the maneuver of burning the AUD/NZD pair in the corner. The average movements are indefinite for now and are moving sideways without signs of the next movement of the trend. We need to pay attention to this time frame to react only when we see a break above or below the trend line up or down. By setting the Fibonacci correction level, we see a withdrawal from the 61.8% level to 1.08000 to the current 1.065000 at the Fibonacci level of 38.2%. In general, at the short-term level, the bearish scenario prevails.
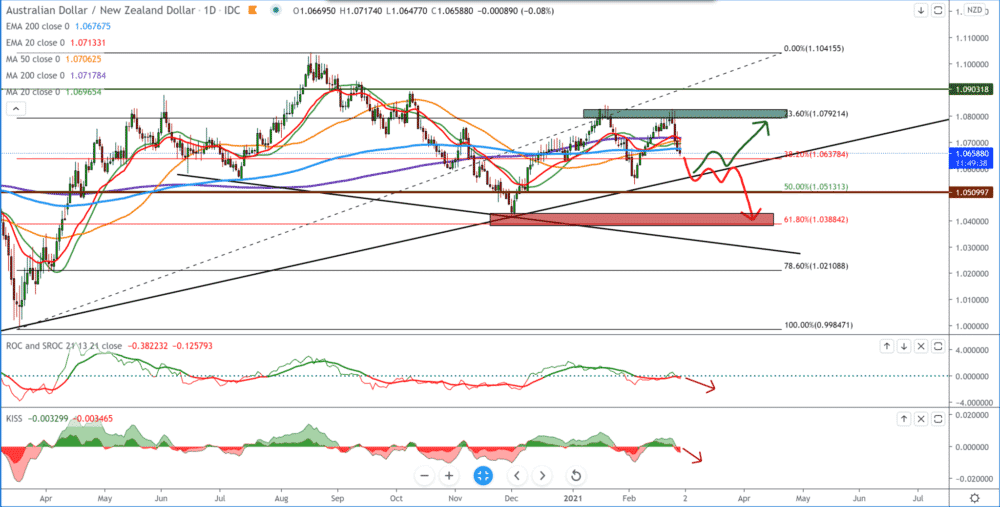
On the daily time frame, we see that the AUD/NZD pair bounced twice from the 0.80000 level. At the bottom, we draw a trend line connecting the previous lows, and we can use it as potential support for the continuation of the bullish trend and an obstacle for the bearish trend. For the target, we are currently looking at zone 1.05700-1.06000. If we look at moving averages, they are on the mild bearish side and based on them, and we expect a short-term continuation of the decline to the bottom trend line.
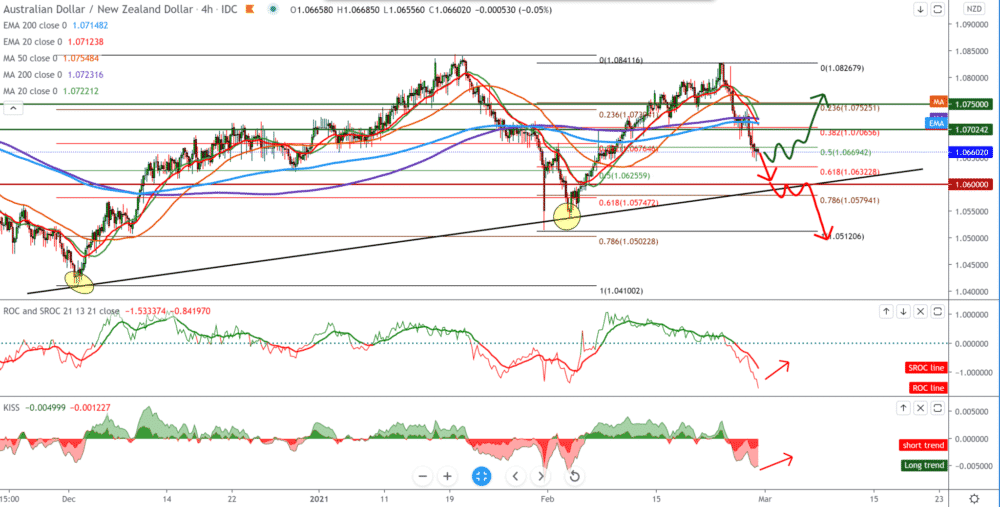
On the four-hour time frame, we see that the AUD/NZD pair bounces off the bottom trend line, and with the Fibonacci retracement level setting, we see that the AUD/NZD pair bounces off 61.8% Fibonacci levels. And now we are close to that level again, and we see the AUD/NZD pair slowing down at the moment, and there is a chance to see a reversal of the trend and move back to the bullish scenario. If not, we go down to test the bottom trend line at 1.06000. A break below the bottom line of the trend will only strengthen the bearish trend.

-
Support
-
Platform
-
Spread
-
Trading Instrument


