


AUD/JPY forecast for December 15, 2020
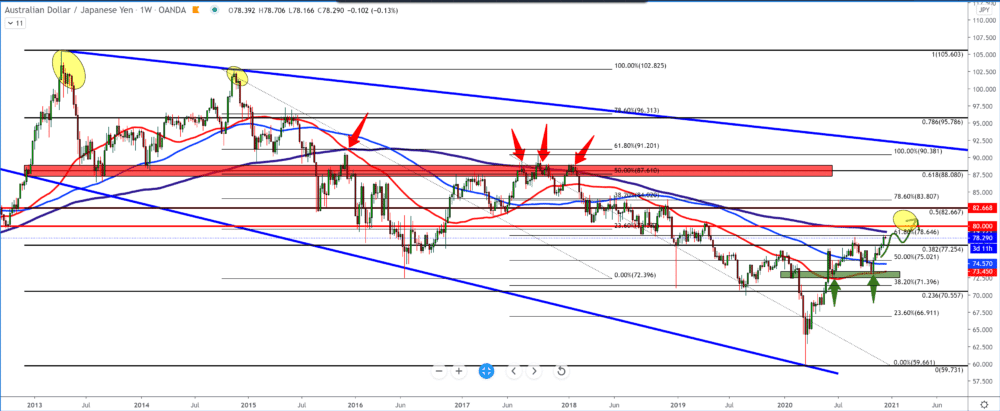
Looking at the chart in the weekly time frame, we can notice that the AUD/JPY pair is currently testing the moving average of the MA200. In August 2015, the pair fell below the MA200, and after that, this indicator became resistance; in 2017, the AUD tried three times to break above but failed and returned down to lower levels.
Now AUD has another attempt to break above MA200 as it has support for MA50 and MA100 and zones at 75.00. A break above 80.00 would be a real confirmation for the further bullish continuation of the trend. If the MA200 is an obstacle for the AUD, we can expect a pullback first to 77,250 support for a higher Fibonacci level of 38.2%.
On the daily chart, we can see how the pair has grown, and so far, there has been a slight consolidation to support at 77.00. The AUD/JPY pair supports all three moving averages and the trend line from the bottom on the daily time frame.
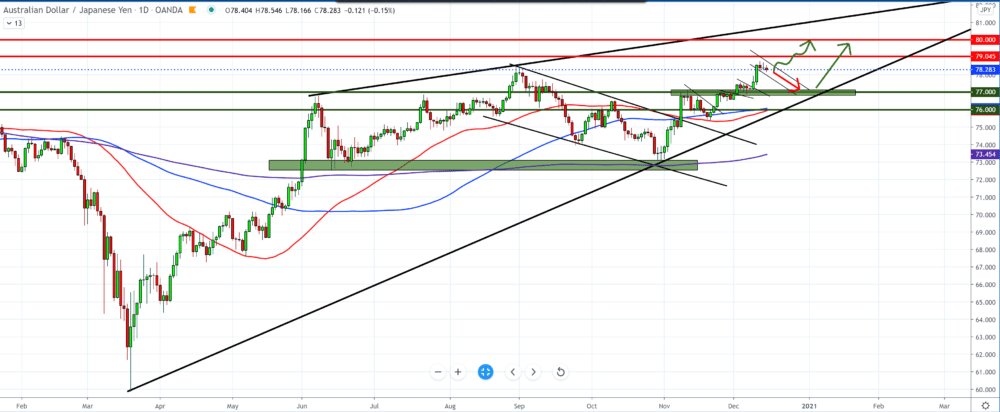
Looking at it this way, the bearish scenario is a short-term scenario up to the trend line. The bigger picture tells us that the trend is still bullish with logical pullbacks. If we want to buy this currency pair, we need to wait for the end of consolidation and confirmation of candlesticks on the chart.
GBP/JPY forecast for December 15, 2020
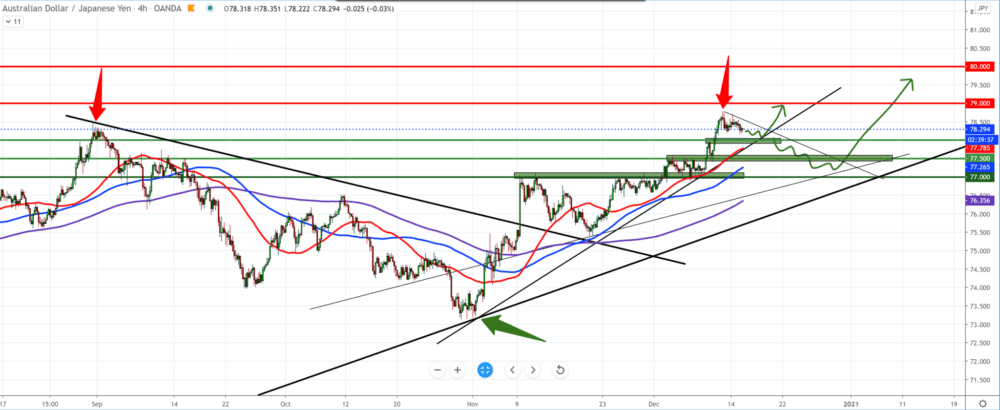
On the four-hour chart, we see that AUD has a good of support from the bottom and that we can now track this only as consolidation before the next bullish pulse. For now, the AUD/JPY pair has the support of all three moving averages, and can we expect the pair to approach them because we expect a pullback to the support color.
-
Support
-
Platform
-
Spread
-
Trading Instrument

