

Ascending Triangle Pattern: Trading Strategy Guide (Part 2)
On the first part of the ascending triangle pattern , you’ve learned the idea of how this strategy works and what it indicates within the market. Now on the second part of the topic, we’ll share with you the proper timing of your entry, the proper stop loss, and the winning exits.
Continue reading now, as this strategy help you win in the market. Let’s start on the three techniques to better time your entry.
Entry timing
There are three methods to do your entry trade. One, on a stop order. Two, on a break and close. Three, on a re-test trendline. Now let us elaborate on each and understand further.
Stop order
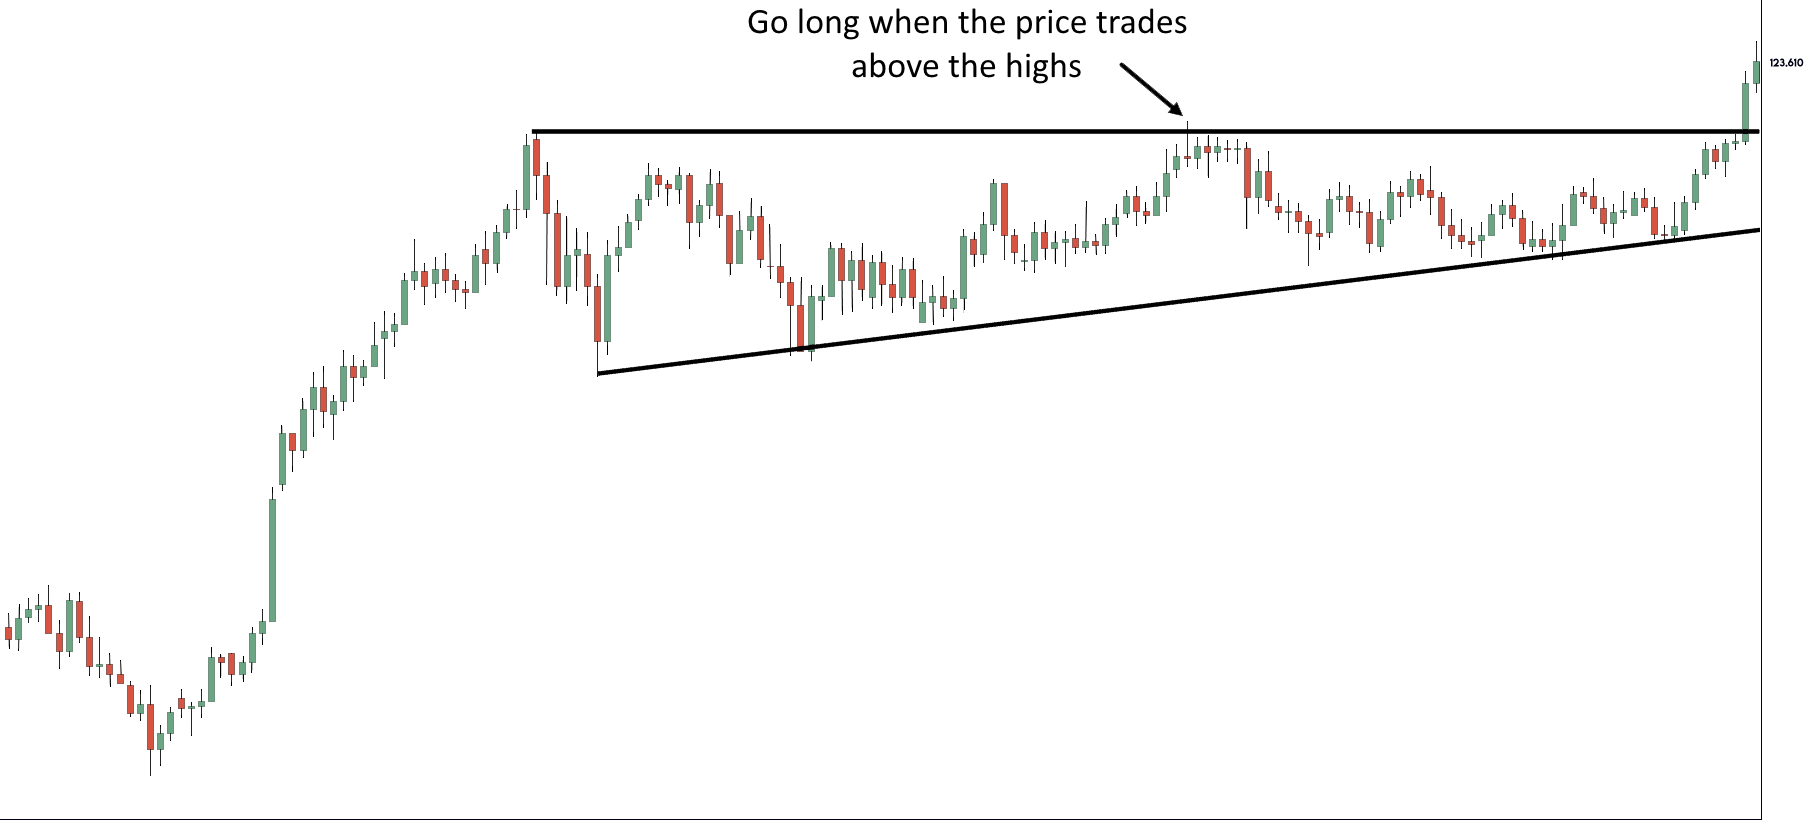
The stop order technique may go long whenever the price trades over the high of the ascending triangle. As a result, you need to do is set a buy stop order, then you’ll immediately get long whenever the price trades over the highs. On one hand, looking at the advantage of this technique is it could be the best price to go enter whenever a breakout is true. On the other hand, looking at a disadvantage, it could be a false breakout.
Look at the sample chart below.
 Break and close
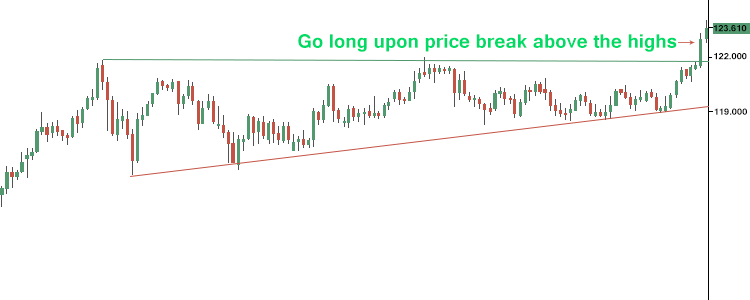
Break and close have some similarities with the first technique. What makes this one different is the need to wait for the price to break and close over the highs. On one hand, looking at the advantage, this one will help reduce the risk of a possible false breakout. On the other hand, looking at the disadvantages, when the momentum comes strong, you are to enter a trade at a higher price.
Look at the sample chart below.
 Re-test trendline
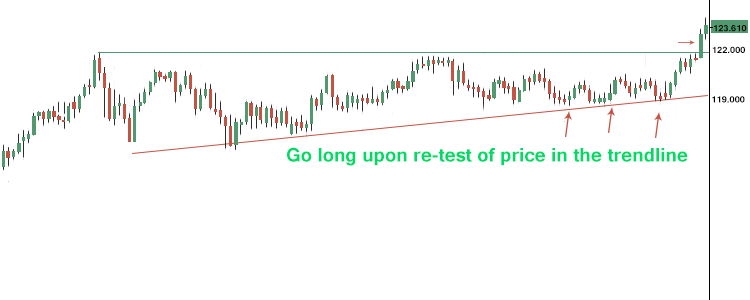
Now, as an experienced trader, you could enter the breakout ahead of the breakout. But how? Well, by going long whenever the price retries the trendline within the ascending triangle. On one hand, looking at the advantages, the favorable risk is to reward you on your trade whenever the market breaks out. On the other hand, looking at the disadvantages, the market might not breakout.
Look at the sample chart below
 Proper stop loss
Even if you’re trading with ascending triangles, breakouts, or other strategies, the concept will be the same. The stop loss should be place in which if reached could invalidate the trading setup. To clarify, it means that whenever the market hits the stop loss, you will then know you are wrong. Look at the sample chart below.
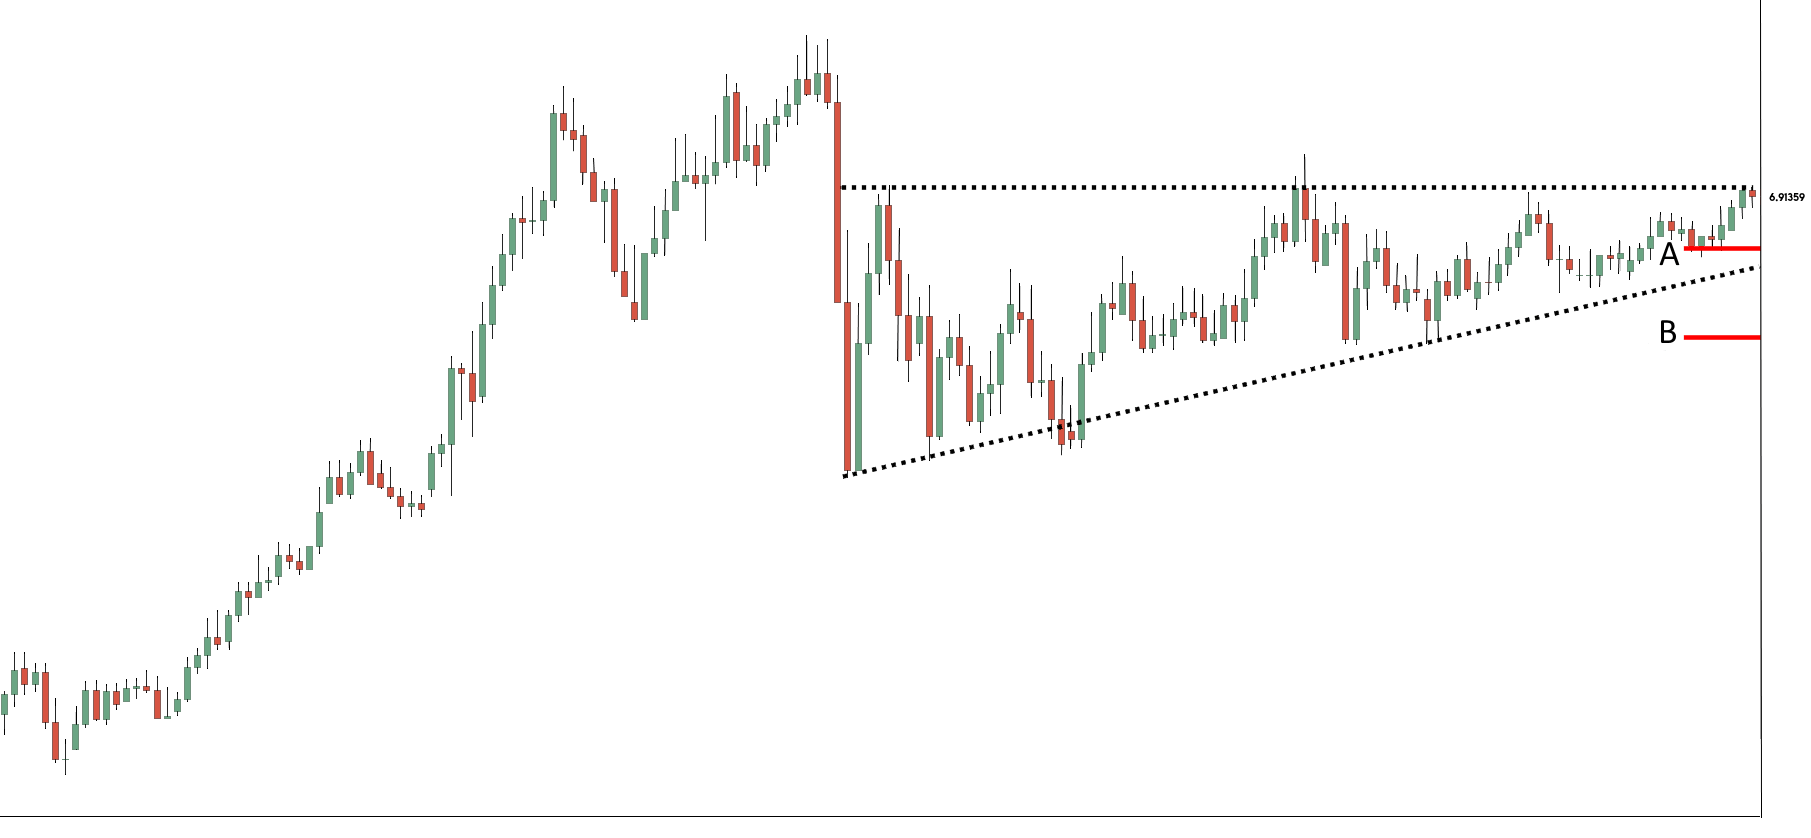 Observing the sample chart below, you’ll see item A and item B locations. Both have different indications. Item A is not that good level its price is within the ascending triangle pattern. Meanwhile, item B would be the ideal stop loss as the market reaches that point, you’ll know that the ascending triangle pattern is ruined.
Winning Exits
Now let us go on to the winning exits. There are about two techniques that you should consider now. One, the trailing stop loss, and two, the price projection. We’ll explain each further.
The Trailing Stop Loss
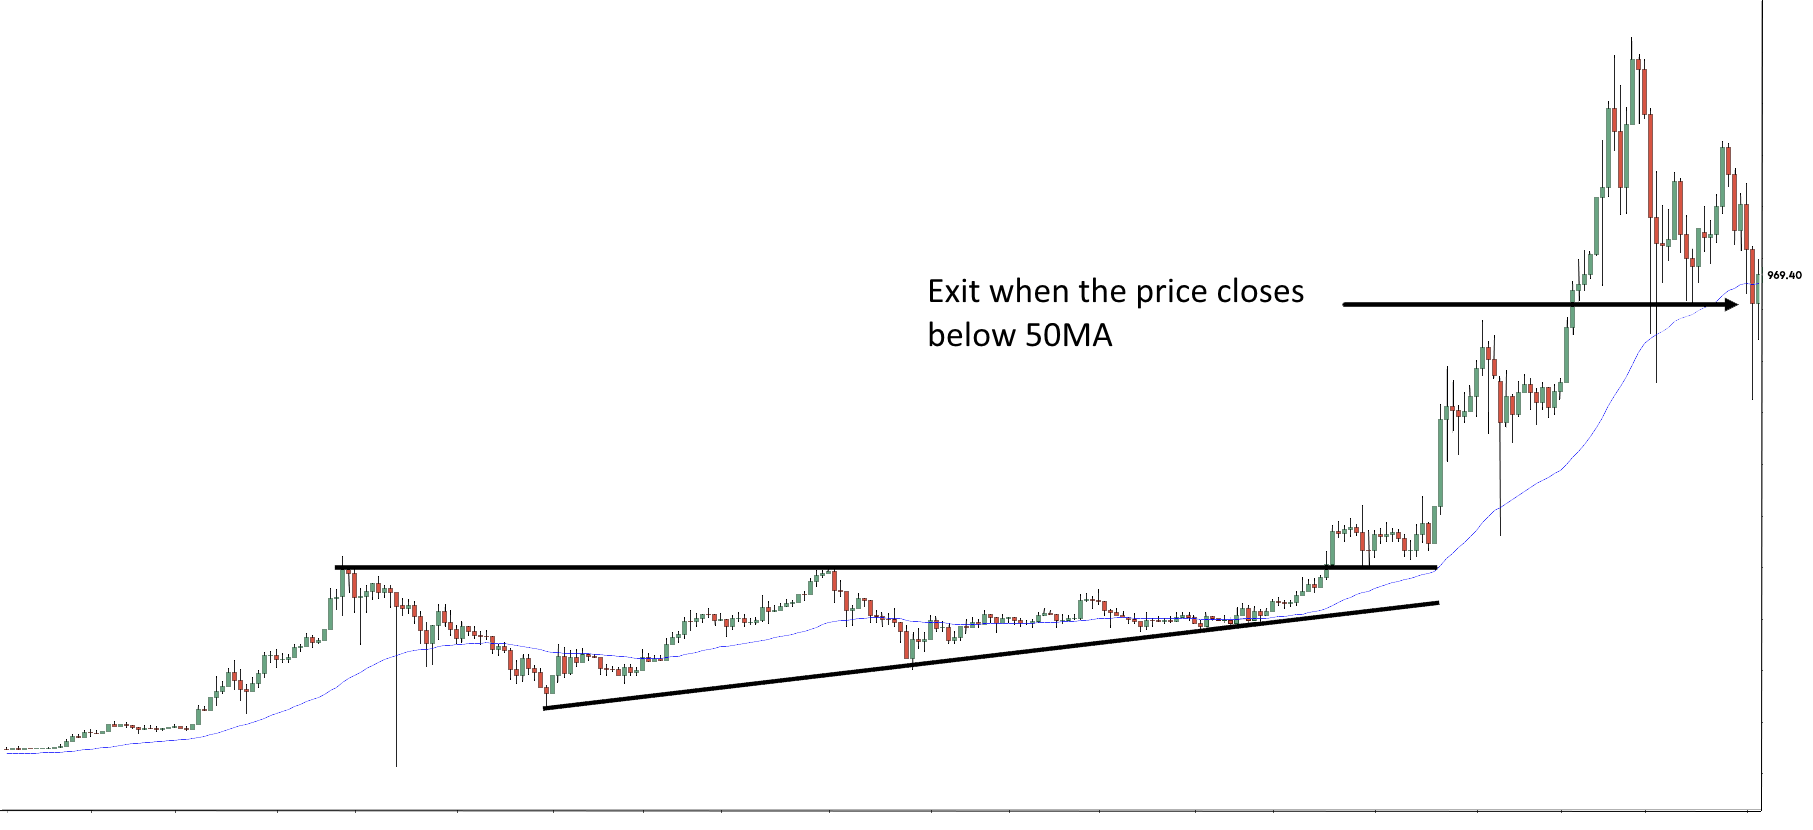
As you have no idea how much longer a trend last, you are to trail your stop loss and “lock in” the gains whenever the market moves towards your favor. You could use a moving average indicator to do this.
Whenever you are long, you can trail a stop loss using a 50-period moving average. To clarify, you are to hold your position until the market breaks, closing below the 50-period moving average. Look at the sample chart below.
 The Price Projection
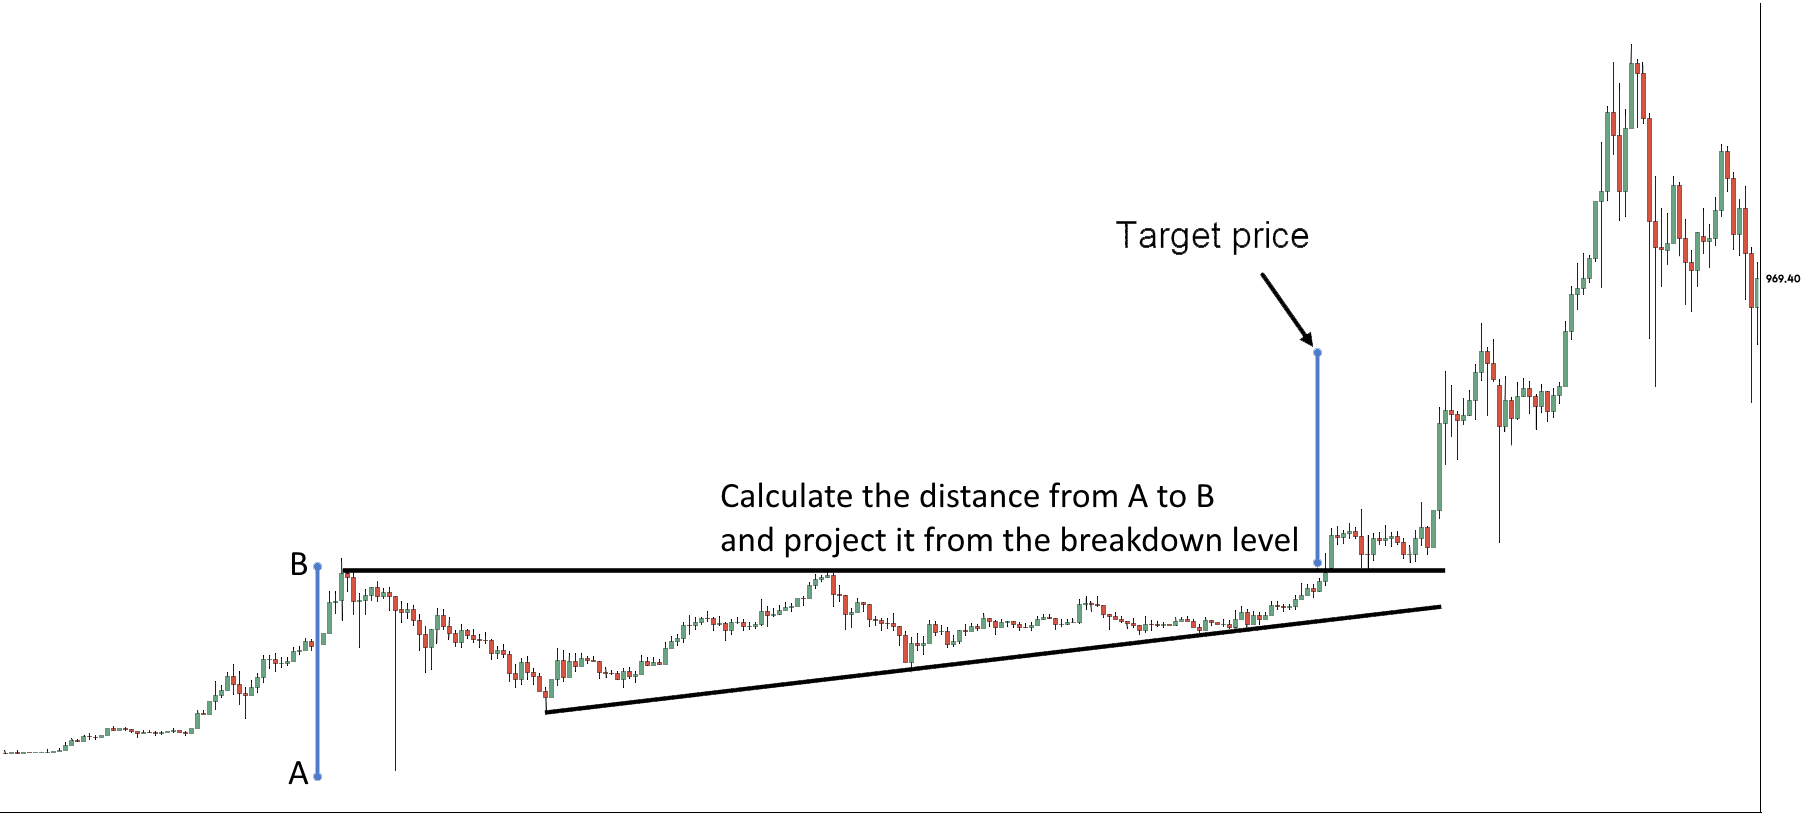
Moreover, a classic charting method to project where the price rest. You could use on chart patterns including ascending triangle, head & shoulders, and etc.
There are two ways to make it work on the ascending triangle pattern. One, calculate the width of the present ascending triangle, from its high to its low. Two, add the amount on the breakout level and that will be your price projection. Look at the sample chart below.
 That ends our lesson on Ascending triangle pattern. Watch out for our next educational post soon.

