


April 06 chart overview for EURUSD, GBPUSD and USDRUB
- Yesterday, the euro failed to find support and stay above 1.09500; in contrast, we saw a break below and a drop in EURUSD below 1.09000.
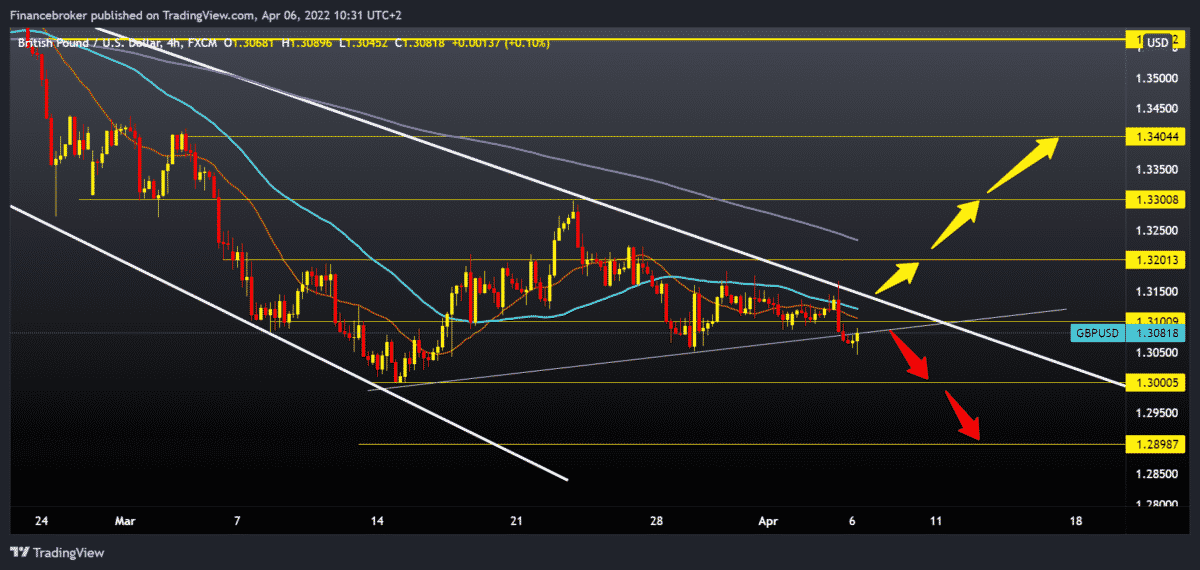
- The pound also had a withdrawal yesterday after failing to maintain its position above 1.31500.
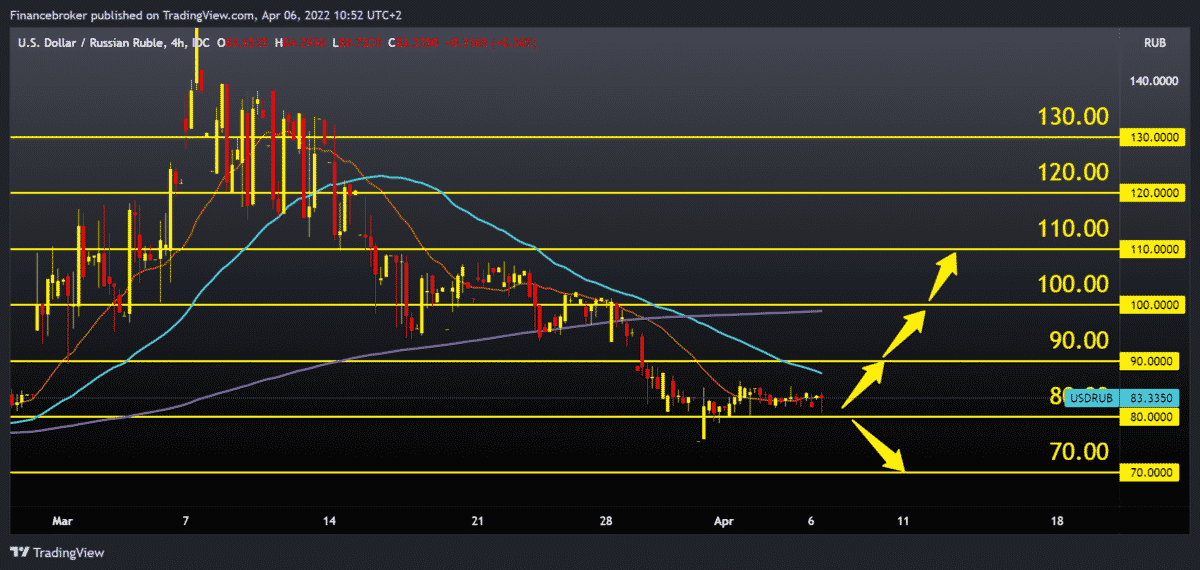
- The pair fell to a low of 75,600 on March 31, after which it moves this week in the range of 80,000-86,000.
- Despite escalating inflationary tensions and concerns about the impact of the war in Ukraine, the construction sector in the UK has seen another strong growth.
- German factory orders dropped more than expected in February, mostly due to falling foreign demand, Destatis data showed on Wednesday.
EURUSD chart analysis
Yesterday, the euro failed to find support and stay above 1.09500; in contrast, we saw a break below and a drop in EURUSD below 1.09000. If further negative consolidation and pressure on the euro continue, it is realistic to expect that we will descend to the March minimum of 1.08000. The crisis in Ukraine is not subsiding, there is no significant progress in the negotiations, and the EU and America are imposing new sanctions on Russia every day. All this has a negative impact on the global market and economy, and most of all, on the euro because the conflict is on its territory. Russia has also introduced countermeasures that affect the energy sector; it demands that enemy countries pay their obligations for the import of gas and oil in Russian rubles. European countries are explicitly opposed to that, which could shake the euro even more and lower it to the level at the beginning of the coronavirus crisis, around 1.06000. For the bullish option, the euro needs to rise above 1.10000. If it succeeds, it could gain support in the bottom trend line, MA20 and MA50 moving averages. Our next potential target is the 1.11000 level and MA200 moving average, then the previous March’s higher high at 1.11855.

GBPUSD chart analysis
The pound also had a withdrawal yesterday after failing to maintain its position above 1.31500. We can say that GBPUSD has reached the upper trend line, found resistance there and retreated back to lower levels of support. At the bottom of the chart, I can see that the pair made a break below the bottom line of support and formed a new lower low at 1.30475. This could be a sign of further withdrawal and testing of the March minimum at 1.30000. The British, just like the EU, imposed sanctions on Russia, and that had a counter-effect on the pound. For the bullish option, we need a new positive consolidation and a return above 1.31500. After that, we would get support in MA20 and MA50 moving averages. The pair would also break above the upper line of resistance. Our next target is the 1.32000 level and MA200 moving average, and a break above them would increase bullish optimism for potential further recovery.

USDRUB chart analysis
The pair fell to a low of 75,600 on March 31, after which it moves this week in the range of 80,000-86,000. We are currently at 83,950, and we can say that the USDRUB is stable for now after a stormy March. Now we are back in the pre-war zone of movement in Ukraine. At the current level, we can expect the pair to continue towards 90,000 and make a new turn to the bullish side. For the bullish option, we need USDURB growth above 90,000, and then we would get support in MA20 and MA50 moving averages. Our next bullish target is the zone at 100,000, and the additional resistance at that level is in the MA200 moving average. A break above would boost bullish optimism. We need a new drag below 80,000 levels for the bearish option, and our first potential support is at 70,000 levels. In the range of 70,000-80,000, the pair moved during 2020 and 2021.

Market overview
GBP news
Despite escalating inflationary tensions and concerns about the impact of the war in Ukraine, the construction sector in the UK has seen another strong growth. This was shown by the results of a survey published on Wednesday by S&P Global.
The Chartered Institute of Procurement & Supply Construction Managers Index reached 59.1 in March, the same as in February. The forecast was that the readings would fall to 57.8.
The April result signalled a combined fastest production growth rate since June 2021.
Unbalanced supply and demand led to a rapid rise in average costs in March due to escalating energy, fuel and commodity prices. The overall inflation rate of input prices was the highest in the last six months.
According to a survey, trust among constructors has reached its weakest since October 2020.
German news
German factory orders dropped more than expected in February, mostly due to falling foreign demand, Destatis data showed on Wednesday.
Factory orders fell 2.2 % in February, up from a 2.3 % increase in January. Economists forecast a decline of 0.2 %. The annual growth of total new orders unexpectedly fell to 2.9 % from 8.2 % in January.
New foreign orders have fallen 3.3 % since January. Within this demand, orders from the eurozone fell by 3.3 %, and from economies outside the eurozone by 3.4 %, and domestic orders recorded a monthly decline of 0.2 %.
-
Support
-
Platform
-
Spread
-
Trading Instrument

