


A weak dollar pushes Bitcoin and Ethereum
Bitcoin chart analysis
Bitcoin is again taking the lead in market share from altcoin after its dominance of market capitalization reached its highest level since November 2021 last week. Data from CoinMarketCap and TradingView reveal that BTC at one point accounted for over 42% of the total crypto market capitalization at the end of January.
By identifying groups of offers for whales, Whalemap revealed what seems to have restored market confidence among those with some of the largest BTC balances – between 100 BTC and 10,000 BTC. “Recent prices have prompted whales to accumulate bitcoin,” researchers summed up on Twitter on Tuesday. According to the cluster, the whales now own 330,000 BTC purchased at spot prices between $ 36,000 and $ 38,000.
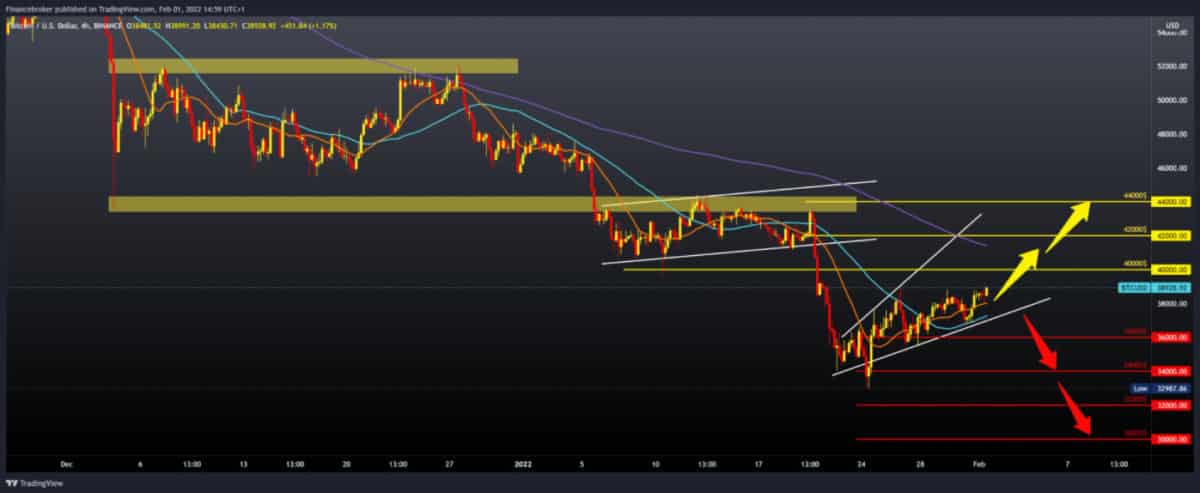
Bitcoin is currently trading at $ 38,500, continuing its bullish consolidation on January 24. Cryptocurrencies had an unstable week after a sudden drop in bitcoin to $ 33,000 on January 24. However, the 9% drop recovered quickly within 8 hours after the price of BTC regained the support of $ 36,000. On January 26, Bitcoin strengthened to $ 38,980 but could not maintain the level and corrected by 8.8% in the next 8 hours to 35,650. Considering the recent ups and downs, Bitcoin managed to gain only 1.6 % in the past seven days. With the current support of the MA20 and MA50 moving averages, we can expect the price to continue to rise to $ 40,000, the next psychological level.
Bullish scenario:
- We need to continue the current positive consolidation and further progress the price closer to $ 40,000.
- This level is our first resistance on the chart, and we are slowly approaching the MA200 moving average.
- The last time we were above MA200 was on December 27 last year.
- If the price of Bitcoin breaks above this resistance zone, the next resistance will be around $ 44,000.
Bearish scenario:
- We need a new negative consolidation and withdrawal of the Bitcoin price below the MA20 and MA50 moving averages and below the bottom trend line.
- Break below the trend line, lower the price on first support to $ 36,000, and then look at the zone around $ 34,000 as higher potential support on the chart.
- The inability of Bitcoin to keep us at that level lowers us to new lows this year.

Ethereum chart analysis
The price of ETUHSD is also currently bullish, forming a new high this week at $ 2805. With the support of the MA20 and MA50 moving averages, we can expect this bullish momentum to continue at a price of $ 3,000. ETH has closed green in the last five days, reaching a key resistance of $ 2,805. Now the price is consolidating below this key level in anticipation of a new attempt to break above if the bullish mood continues. If successful, ETH would be well on its way to reaching $ 3,000.
On the other hand, the $ 2,550 support held up well again yesterday’s test as support. The current bias for ETH is bullish. We will have to watch carefully the key resistance levels of $ 2,800 and $ 3,000 as they will define the price action by the end of the week. ETH is in a good position to break the critical resistance to $ 2,800, as the indicators have become bullish. Buyers should wait patiently until the breakthrough is confirmed with a successful retest of resistance as support.
Bullish scenario:
- We need to continue this positive consolidation to lead us to $ 3,000 next potential resistance.
- Another resistance at that level is the MA200 moving average, bringing us back to the bearish trend.
- A break above this resistance zone opens up space for $ 3,200 to the next potential resistance, and as the bullish momentum continues, we can expect to climb up to $ 3,400.
Bearish scenario:
- We need negative consolidation and price withdrawal from the current $ 2800.
- Then we go down to the bottom line of the trend in the zone around $ 2500, additional support in that zone can be provided by MA20 and MA50 moving averages.
- If that doesn’t help us, the price will break below the trend line and move to $ 2,200 last week’s low.

-
Support
-
Platform
-
Spread
-
Trading Instrument

