


30 March charts overview for EURUSD, GBPUSD and USDRUB
- EURUSD pair literally exploded yesterday.
- Pair GBPUSD found support in the zone around 1.31000.
- USDRUB pair reached its peak at 154,300.
- Eurozone economic confidence fell more than expected in March.
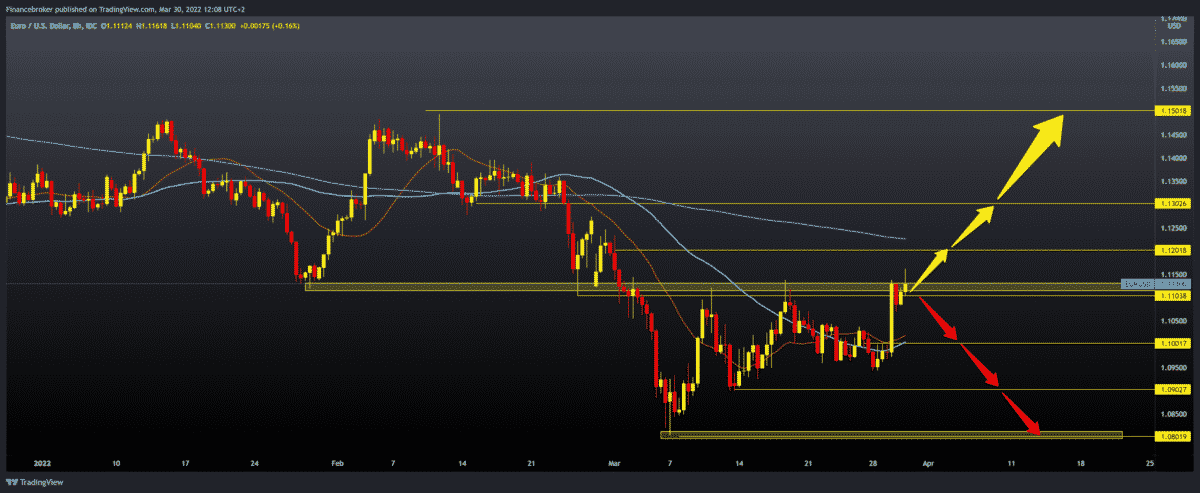
EURUSD chart analysis
The EURUSD pair literally exploded yesterday. The starting position was at 1.10000, after which we have a jump to 1.11350. The reason is the meeting of the Russian and Ukrainian delegations on ending the invasion and other conflicts. What helped EURUSD was that the news after the meeting was positive and that made progress in the talks and converged different positions on both sides.
We had a pullback during yesterday’s U.S. session that ended as the Asian session began, leading to a new strengthening of the euro against the dollar. This morning after the opening of the European session, the pair managed to make a break above yesterday’s high and form a new high this month at 1.11600.
The next bullish target is the zone around 1.12000, and additional resistance to this level may be the MA200 moving average. For the bearish option, we need new negative consolidation and pullback prices to previous support zones at 1.11000. Additional support at that level is in the MA20 and MA50 moving averages. The break below lowers us to 1.09500 previous low. And if it does not last, we continue further to 1.09000, and maybe to the March low to 1.08000.

GBPUSD chart analysis
Pair GBPUSD found support in the zone around 1.31000 yesterday, after which we have the current bullish impulse that raised us to 1.31500. We are currently testing the MA50 moving average, and we need a break above to continue towards the upper resistance line in the zone around 1.32000.
Breaking the GBPUSD above the resistance line would boost bullish optimism, which would lead to a continuation of the bullish trend. Our next target and potential resistance is the zone around 1.33000, and the additional pressure at that level can create a moving average for the MA200.
For the bearish option, we need a new negative consolidation and withdrawal of GBPUSD to the previous support zone around 1.31000. A fall below would increase bearish pressure, which would lead to a drop to 1.30000 psychological level of support and this year’s minimum.


USDRUB chart analysis
This morning during the Asian session, the dollar fell to a new one this year at 81,000. At the beginning of the month, the USDRUB pair reached its peak at 154,300 as a result of Russia’s attack on Ukraine and the application of sanctions by the EU, America and other allies. After that, consolidation started, and now we are back to the period before the start of the invasion at 81,000 Russian rubles for one US dollar.
Russia’s countermeasure was that all enemy countries that buy oil and gas pay their obligations in rubles. This led to the strengthening of the Russian ruble. We need to go back above the 100,000 level and moving averages for the bullish option to get technical support on the chart. After that, we can expect a potential continuation of the bullish trend. We need a continuation of this negative consolidation and a further pullback below the 80,000 support zone for the bearish option. If this zone does not support us, we will continue towards the next lower support zone at 70,000, and the last time we were here was in November last year.

Market overview
Eurozone economic confidence fell more than expected in March, largely due to a sharp drop in consumer confidence, the European Commission’s results showed on Wednesday.
The economic sentiment index drop to 108.5 in March from 113.9 a month ago. The forecast was at 109.0.
The decline in March was largely due to a decline in consumer confidence, followed by significant losses in retail trade and industry confidence.
Consumer confidence dropped dramatically to -18.7 from -8.8 in February. The decrease was caused by the collapse of household expectations about the general economic situation and their own future financial situation.
Reflecting the sharpest decline in production managers’ expectations since the COVID-19 pandemic, industry confidence fell to a one-year low of 10.4 from 14.1 in February.
-
Support
-
Platform
-
Spread
-
Trading Instrument

