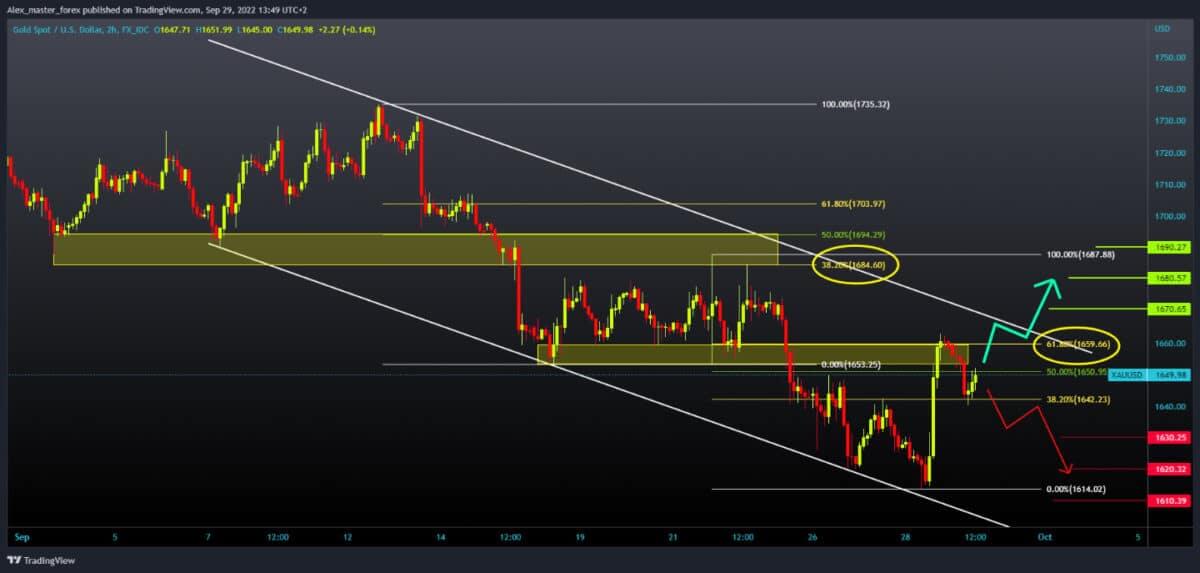
Yesterday, the price of gold formed a new two-year low at the $1614 level. Shortly after that, rapid recovery of the price followed, reaching the $1,660 level. During the Asian session, the price makes a pullback to $1640 and finds support there, and starts a new bullish impulse. This level coincides with the 38.2 Fibonacci level. A drop in prices below would probably lead us to further testing the previous low, while for a bullish option, we need a break above the $1660 level and try to hold on there. With a new bullish impulse, the price of gold could recover to the previous high at the $1685 level. We are still in a two-week descending channel, and the price will continue to decline as long as we are in it.
Silver chart analysis
The price of silver managed to recover yesterday, but only up to $19.00, where it encountered new resistance. During the Asian session, we see pullback prices to the $18.50 level. For now, we manage to find little support at that point and hold before the next major impulse. The price of silver did form a new higher low but failed to create a higher high. Based on this, we can expect the silver price to continue falling. If we fail to make a more concrete step above $18.80 at the 38.2% Fibonacci level, the price could start a stronger bearish trend. Our targets are again the previous low at $18.00, then the September low at $17.53. With a bullish option, we need a jump in the price of silver to the 50.0% Fibonacci level at $19.20. If we could do that, we would have a better chance to first stay in the $19.20-$19.60 zone. Then, with a new bullish impulse, the price will make break above and maybe test the $20.00 level.