


29 September, chart overview for Bitcoin and Ethereum
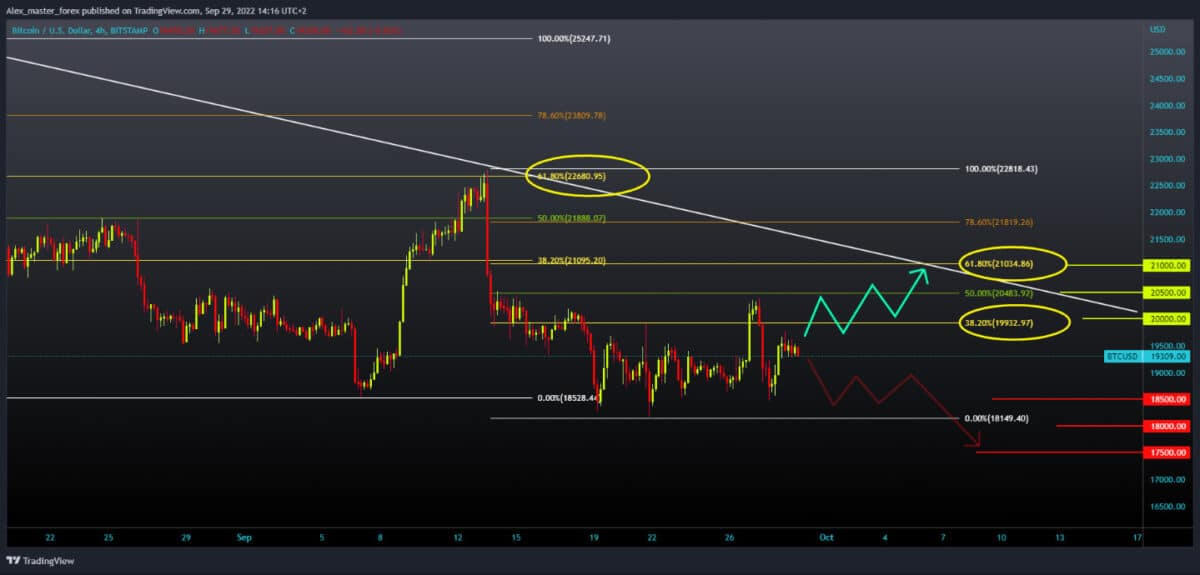
Bitcoin chart analysis
Today, the price of Bitcoin is stable, maintaining around the $1950 level. Yesterday, it fell again to the $18,500 level, where we have had support for the previous ten days. For now, it is calm, and we are waiting for data on US inflation, which will be published before the start of the US session. Everything depends on that data and how it will affect the dollar index. We need to climb above the $38.2 Fibonacci level to continue the bullish option. We succeeded in that yesterday, and if we did it again today, we would have a better chance of forming a new higher high. Target is 61.8% Fibonacci level at $21000. We need a decline and a negative consolidation to the $18500 level for a bearish option. The increased pressure and hold on that spot could push the price of Bitcoin even lower. Potential lower targets are the $18,000 and $17,500 levels.

Ethereum chart analysis
For the tenth day in a row, the price of Ethereum is moving in the range of $1200-$1400. Now we are in the middle of the zone around the $1300 level. Since yesterday, we have been in a bullish consolidation after the price dropped to $1250. If this consolidation continues, we could retest $1400 and climb to the 38.2% Fibonacci level. For the bullish option, the price must break above to continue towards the $1500 level. Then we need to maintain above the 50.0% level in order to climb to the 61.8% Fibonacci level and the upper trend line with a new bullish impulse. We need more pressure on the $1200-$1250 support zone for a bearish option. A longer stay in this zone could have a negative effect on the price. Potential lower targets are $1150 and $1100 levels.


