


14 April chart overview for Bitcoin and Ethereum
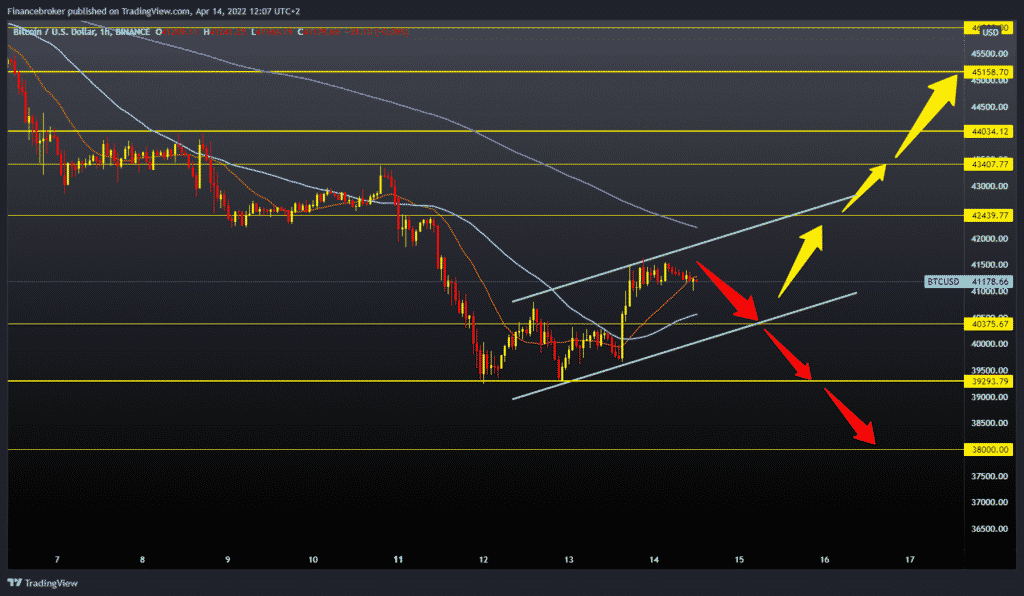
- The bitcoin price is currently in lateral consolidation with resistance at $ 41,500.
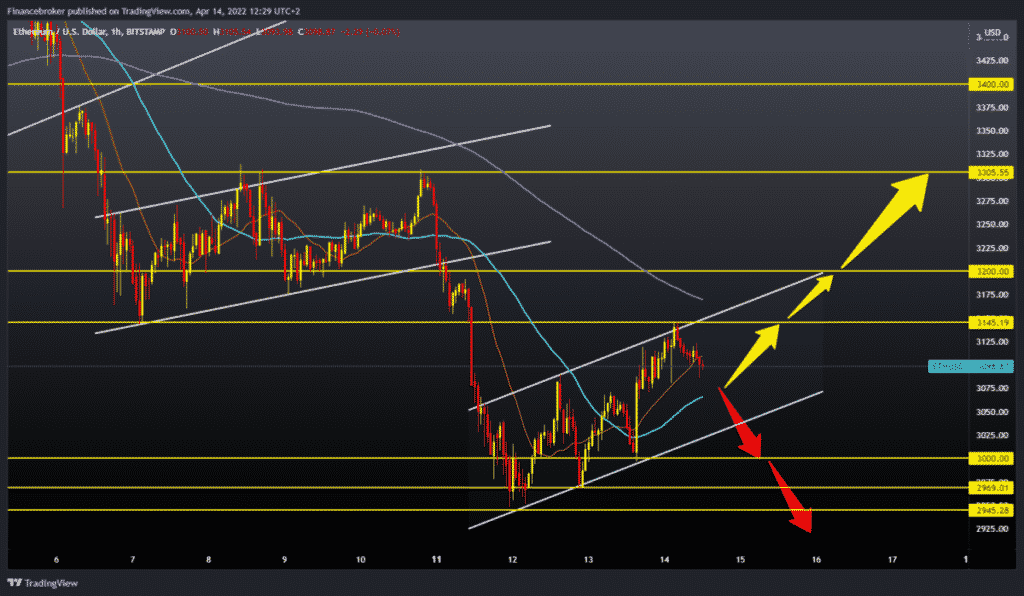
- Ethereum’s price is still in bullish consolidation after it formed its lower low at $ 2,945 on April 12.
- Cryptocurrency traders remain scared amid subdued market recovery, according to a popular index.
Bitcoin chart analysis
The bitcoin price is currently in lateral consolidation with resistance at $ 41,500. We see a slight pullback as part of this consolidation to a $ 41,000 price tag. And we can expect Bitcoin to find support in the MA 50 moving average in the zone of around $ 40,500. On the chart, we can form a smaller growing channel in which the price of bitcoin has been moving since April 12. The target of potential support is at the bottom line of this channel. A break below that line would open us up to the previous support zone at $ 39,290. If this knows it can’t withstand the pressure, the price continues until the following support in the zone of around 38,000 dollars. For the bullish option, we need a continuation of positive consolidation to the $ 42,000 level. Additional potential resistance to that level is in the MA200 moving average. If the price exceeded $ 42,500, then it would be outside this channel, and that would be a sign that we can expect the bullish trend to continue.

Ethereum chart analysis
Ethereum’s price is still in bullish consolidation after it formed its lower low at $ 2,945 on April 12. Since then, we’ve had a recovery, and this morning’s high was $ 3,145. We now have a pullback within this consolidation, and we are looking for potential support in the zone around 3050-3075 dollars. The maximum price drop to preserve the bullish impression would be up to $ 3,025, up to the lower support line. A break below would increase bearish pressure, leading to a price drop below the $ 3,000 psychological level. The April minimum is $ 2,945. For the bullish option, we need a new positive consolidation and a new break above the previous high at $ 3145. After that, with the continuation of the bullish impulse, the price could climb to the $ 3,200 zone. Then we would get support and the MA200 moving average which would boost bullish optimism. After such a bullish move, our next potential next target is the $ 3300 level.

Market overview
Fear & Greed index
Cryptocurrency traders remain scared amid subdued market recovery, according to a popular index.

According to the Crypto Fear & Greed Index, the mood in the cryptocurrency market remains in the territory of “extreme fear”. It takes into account several factors, such as volatility, social media posts and trading volume, to determine how investors and traders feel about the current market situation.
The index enters the territory of fear when it falls below 50. It recently published a rating of 25, which indicates extreme fear. The index measures the emotions of cryptocurrency traders on a daily basis.
The market sentiment underwent a significant change in just two weeks. In late March, the index shone for the first time greed after four months after the leading cryptocurrency reached a new high in 2022 of $ 48,200.
Earlier this week, Bitcoin fell below $ 40,000 for the first time since March 16 amid concerns that the US Federal Reserve has adopted an even more aggressive monetary tightening policy to tackle high inflation.
There is a group of opposing traders and investors who tend to buy fear, defying the general mood of the market. Legendary investor Warren Buffett once said one should be greedy when others are afraid. However, the buy cheap, sell high mentality does not always work as planned in crypto. Retail purchases can often have the opposite result.
No matter how low bitcoin goes, it should be borne in mind that it can always fall lower in the “maximum pain” scenario. There were several cases when the index fell below 10 after brutal sales.

