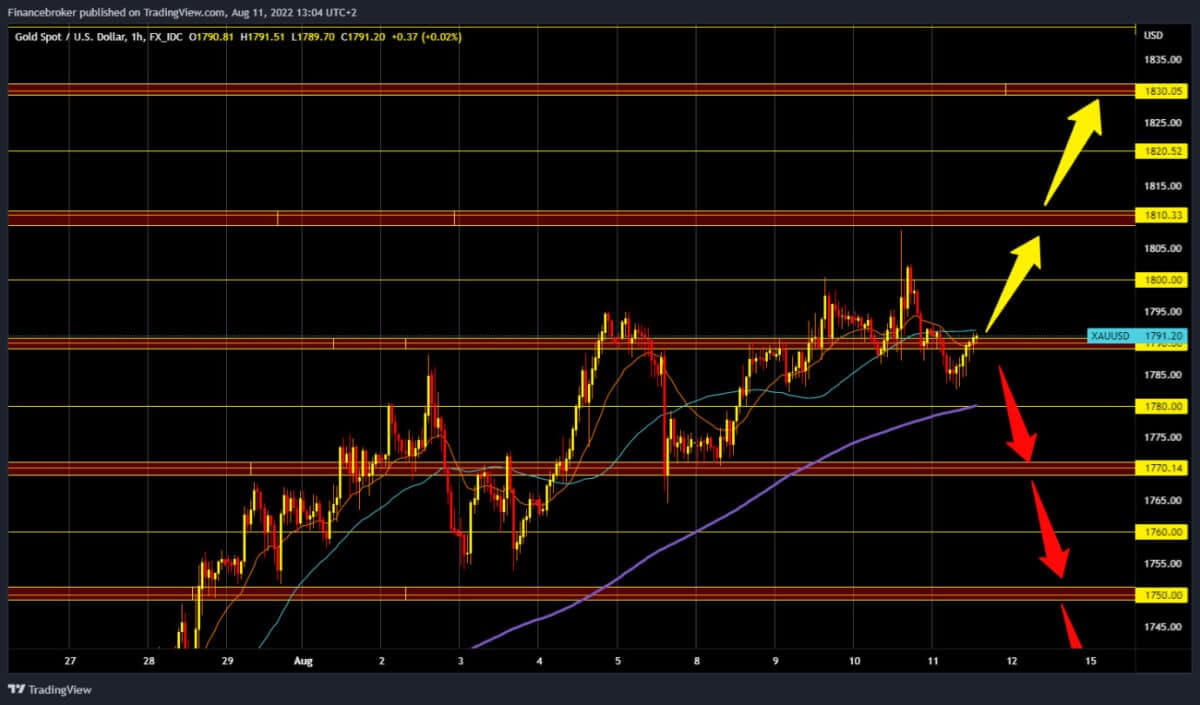
The price of gold was above $1800 for the first time in the last month. Yesterday’s high was $1808, after which we saw a pullback to 17854 levels. During the Asian trading session, we found support there, and the price of gold is entering a new bullish consolidation. We are now at the $1790 level and continue towards the $1800 resistance zone. We need a negative consolidation and price pullback towards the $1780 level for a bearish option. Additional support at that level is in the MA200 moving average. A break below reinforces the bearish pressure, and the price will likely continue to slide down. Potential lower support targets are $1770, $1760, and $175 levels.
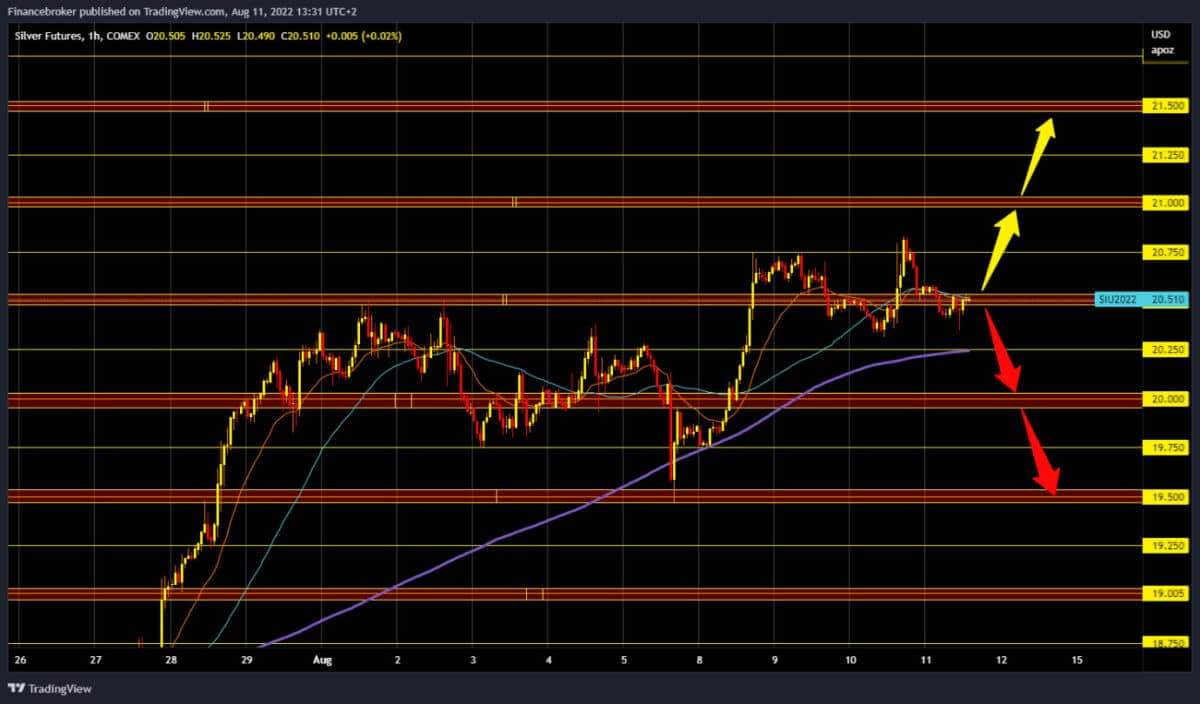
Silver chart analysis
The price of silver retreated from yesterday’s high of $20.83 to this morning’s low of $20.35. We now have support there, and we could rise above the $20.50 level again. Then we would have a chance to visit the $20.75 level once again and try to move on to $21.00, the next higher target. For a bearish option, we need a negative consolidation and pullback of prices to the $20.25 level. Additional support at that point is in the MA200 moving average. The price break below takes us down to $20.00. After that, if the bearish pressure continues, the price of silver could fall even lower. Potential lower targets are $19.75 and $19.50 levels.
Market overview
The gold price is failing to capitalize on the weakness of the US dollar and stagnant Treasury yields. US CPI data shows the first peak in inflation, but not enough to dissuade the Fed from raising interest rates aggressively. The gold price may be helped by the re-emergence of trade tensions between the US and China and new quarantines in some Chinese cities and towns due to new covid cases.