


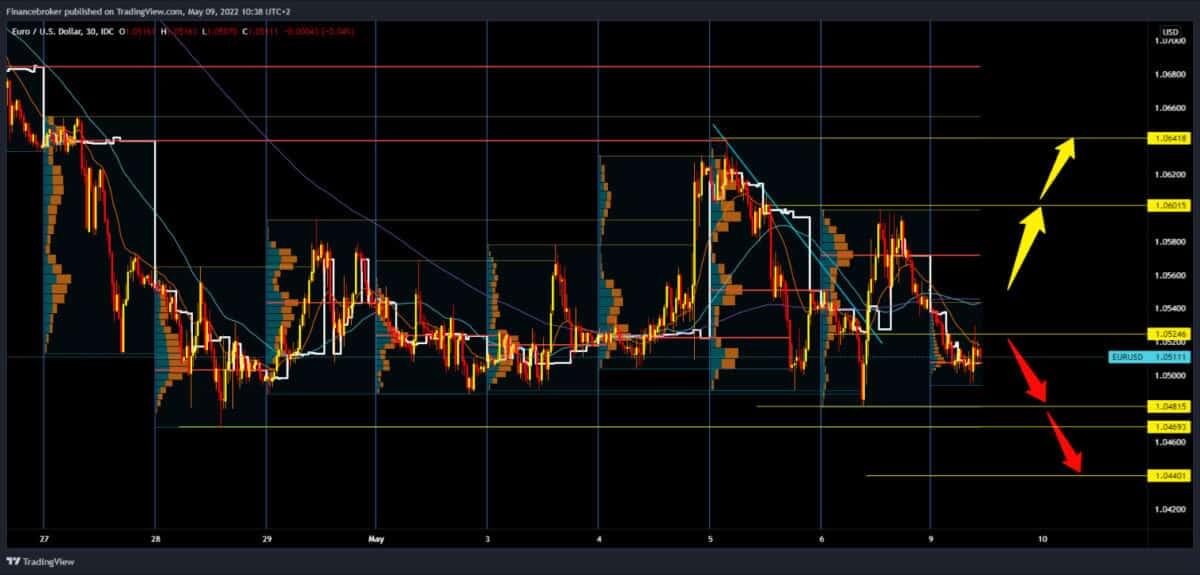
EURUSD chart analysis
During Asian trade, the euro weakened against the dollar. The meeting of political representatives of the EU member states continues today, and a new set of sanctions against Russia is being discussed. The goal is to reach an agreement for the introduction of an embargo on oil imports by the end of this year. This could be a difficult day for the Eurozone economy. As a result, the euro continues to stumble. The euro was exchanged for 1.05093 dollars, which is weakening the common European currency by 0.38% since the beginning of trading tonight. The pair has been ranging from 1.048000 to 1.064000 for a week now. We can notice that there is increasing pressure on the support zone. This situation could lead to a break below this support zone. We will pay attention to levels 1.04815 and 1.04693; these are the previous lows in the last ten days. For the bullish option, we need a new positive consolidation and a return to the zone around 1.05800. We had the biggest hold on Friday, and if there is a break at that level, we can expect the EURUSD recovery to continue. Our following targets are 1.06000, then 1.06418 level high from May 5th.

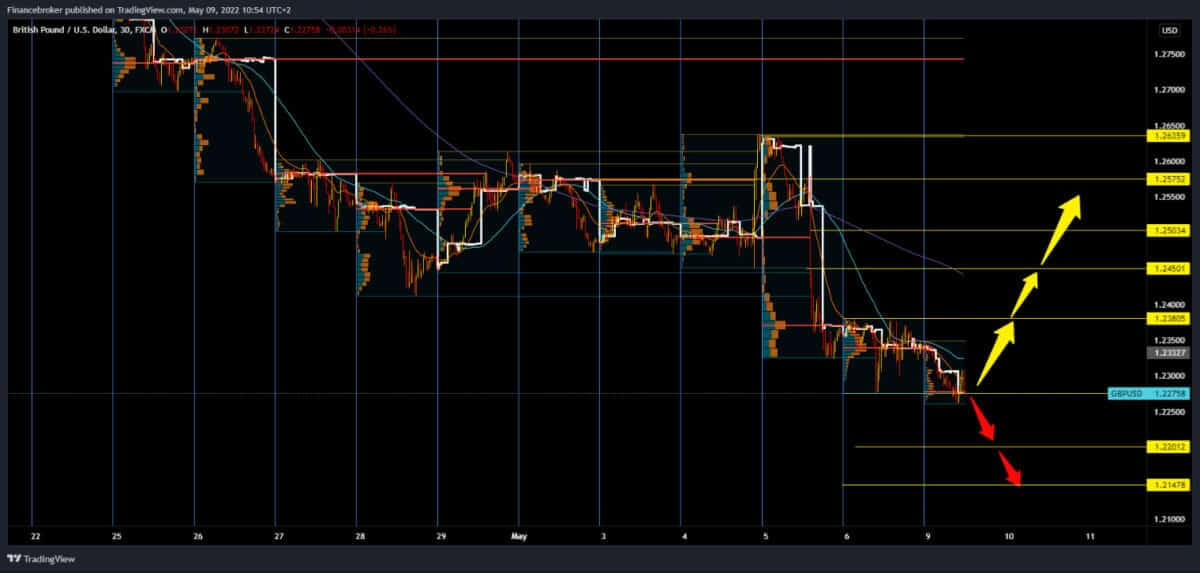
GBPUSD chart analysis
The pound continues its negative consolidation that began on Friday. The pair started the day at 1.32330 level; after that, we see a constant weakening of the pound and a drop to 1.22600 level. Bearish pressure is growing on the pound because the sanctions that the EU and Britain imposed on Russia affect them as well. Inflation continues to rise along with energy prices, leading to a weakening pound and euro. We can expect a continuation of the bearish trend and the pound’s decline to the 1.22000 level soon. We need a new positive consolidation for the bullish option and return first above the 1.23800 zone. After that, the GBPUSD money could climb to the 1.24500 level, where the MA200 moving average awaits us as additional resistance at that level. The following bullish targets are 1.25000, 1.25750 and 1.26360 levels.

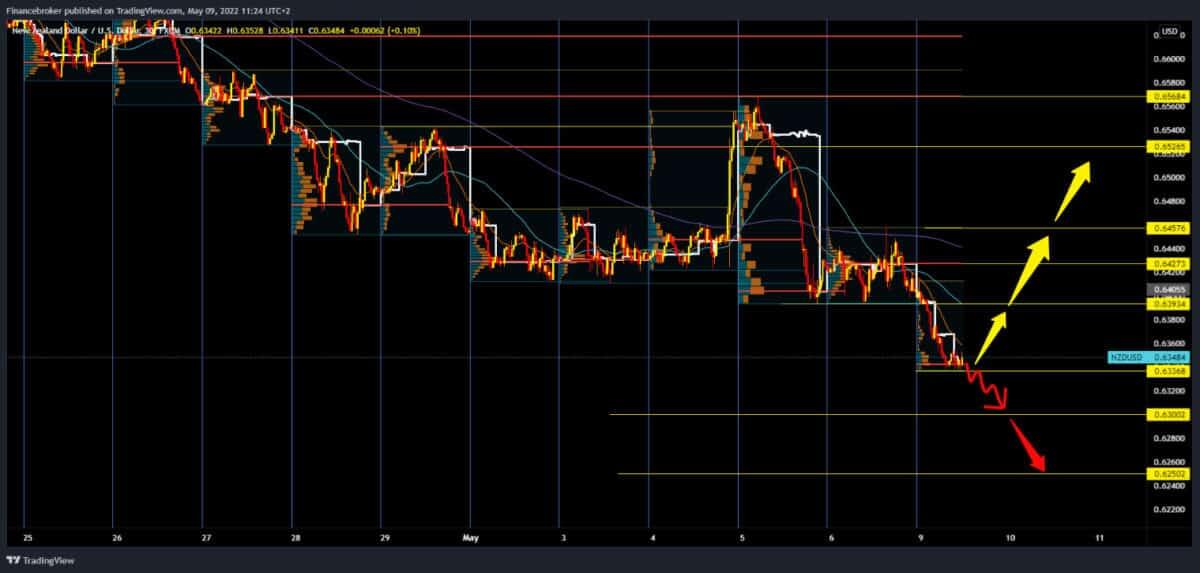
NZDUSD chart analysis
Pair NZDUSD formed a new this year’s lower low at 0.63370; the last time we were at this level was in June 2020. Last Thursday, the NZD weakened sharply; the then high was at 0.65570. Very soon, the pullback started, and the pair dropped to the 0.63930 level on the same day. Friday was boring, and the pair moved in lateral consolidation with slight hints of continuing the bearish trend this week. That is what happened because the NZD has lost 0.90% of its value against the dollar since the beginning of trading. We are looking for potential support in the current lower zone 0.63300-0.63500. The NZD could return to the positive territory if it consolidates and climbs above 0.64000 levels. Such a move would erase the previous losses and form a solid bottom on the chart for the continued recovery of the NZD.

Market overview
Data on the confidence of investors from the Eurozone await us, which could be a positive day for European economic news. Other news: The Statistical Office of Norway publishes data on industrial production for March, data on foreign trade and current accounts are provided by France, and the Czech Statistical Office publishes industrial production and foreign trade (production is expected to fall by 2.6 % year on year in March, after falling 0.3 % in February), foreign trade reports are coming from Slovakia and Hungary.
The Bank of Japan the report
This morning, the Bank of Japan published the minutes from the meeting on monetary policy on March 17 and 18. At that meeting, the bank voted to keep stimulating monetary policy, keeping the interest rate at -0.1 %on current accounts held by financial institutions in the central bank. The bank will also continue to buy the required amount of Japanese government bonds without setting a ceiling so that the ten-year JGB yields will remain at around zero %.

