


04 April chart overview for Bitcoin, Ethereum and Dogecoin
- The price of Bitcoin is in a new retreat because last week’s attempt to break above 48,000 failed.
- The price of Ethereum managed to climb to the $ 3580 level yesterday, and after that, we have a pullback to the current $ 3465 price.
- The price of Dogecoin formed a new higher high on March 28 at 0.1539.
- The bitcoin price could continue to rise, as 19 million BTCs have been mined, with less than 2 million left to be unearthed and put into circulation. Proponents believe that bitcoin draws its value from its limited supply.
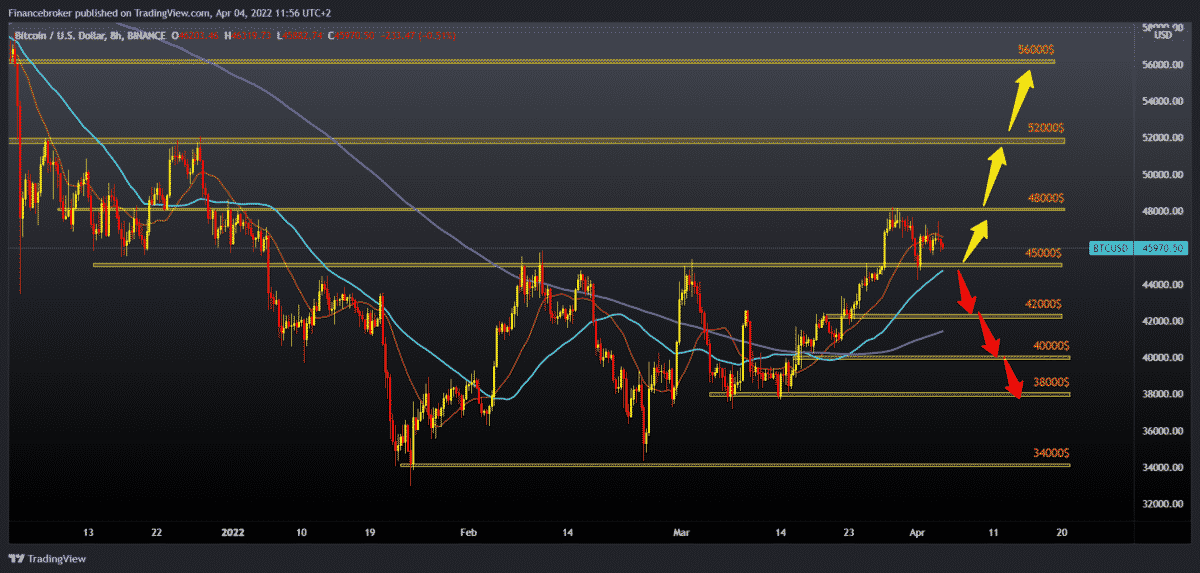
Bitcoin chart analysis
The price of Bitcoin is in a new retreat because last week’s attempt to break above 48,000 failed. The Bitcoin price was around 46,500 dollars during the weekend, and as Monday started, we are again moving towards lower levels on the chart. The current image on the chart tells us that we will see a pullback to support at the $ 45,000 level. Potential additional support in that zone is in the MA50 moving average. If the bearish pressure increases and the price breaks below $ 45,000, then we have space to the next support zone around the $ 42,000 level. We can expect additional greater support at that level in the MA200 moving average, which gives us support from March 16. We need new testing and a break above the $ 48,000 level for the bullish option. After that, Bitcoin will form a new higher high, which is a sign that we are continuing our bullish recovery. Additional confirmation would be when bitcoin would form a potential new higher low. Our next bullish target is $ 52,000, the resistance zone from December 2021, and before that, we come across a $ 50,000 psychological level. As long as the price of Bitcoin is above the $ 42,000 level, we can say that we are in the bullish trend from January 24.

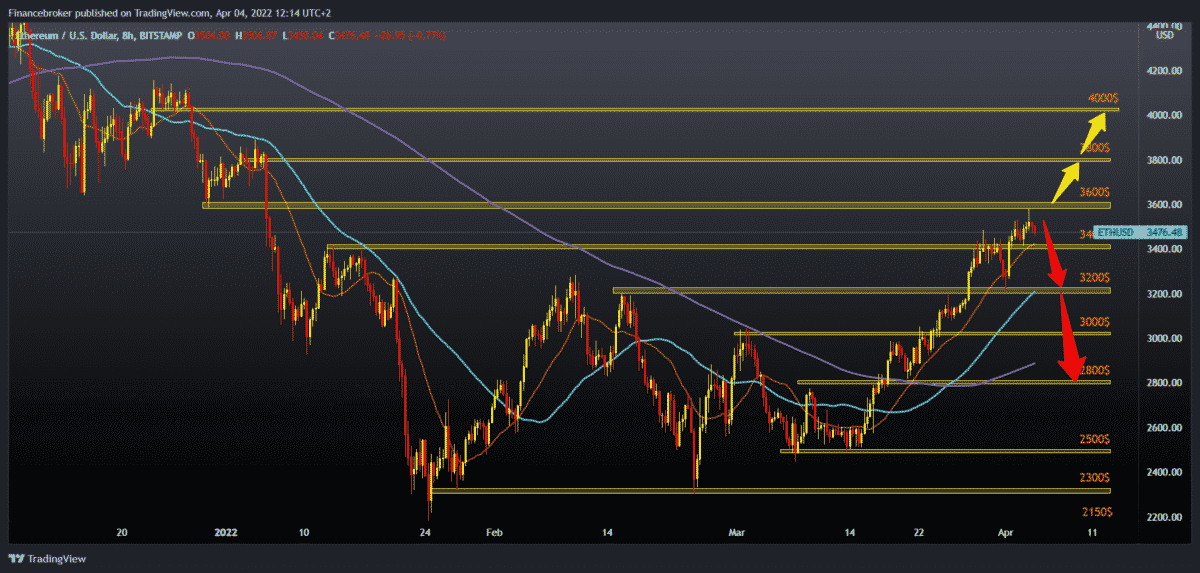
Ethereum chart analysis
The price of Ethereum managed to climb to the $ 3580 level yesterday, and after that, we have a pullback to the current $ 3465 price. For now, we are above the MA20 moving average, which oscillates around $ 3,400 levels. We need a break below the $ 3,400 price for the bearish option, and our target is pre-support at the $ 3,200 level. Additional potential support is in the MA50 moving average. If she doesn’t hold up, we’ll see a further retreat towards the $ 3,000 psychological level. A very important MA200 moving average is in the zone of around $ 2900 price. We need to break above the $ 3600 level for the bullish option and form a new higher high on the chart. Target is the next zone of resistance at the $ 3,800 price. After that, we seek support above $ 3,600 and continue further towards the $ 4,000 psychological level.

Dogecoin chart analysis
The price of Dogecoin formed a new higher high on March 28 at 0.1539. After that, we have a pullback and forming a higher low at 0.1321 on the bottom trend line. The price found support there, but for now, he is not form a new high, and we are stopped at the 0.1500 level. We are currently at 0.1439 and looking again at the bottom line of support, and our target is potential support at 0.1400. If we do not find support here, we will see a break below the support line, and then our target is the previous low at 0.13000 and MA200 moving average at 0.1250. Some maximum pullback can be seen up to the March support zone at the 0.1100 level. We need a break above the top resistance line and 0.15000 levels for the bullish option. After that, Dogecoin must form a new higher high to confirm the potential continuation of the bullish trend. Our target is 0.1600 level from February 10, then the February maximum at 0.1732.

Market overview
Two million bitcoins are left to mined
The bitcoin price could continue to rise, as 19 million BTCs have been mined, with less than 2 million left to be unearthed and put into circulation. Proponents believe that bitcoin draws its value from its limited supply.
The last two million BTCs will be mined at a fixed emission through the schedule of supplies and mining activities. This has fueled a bullish narrative among investors. In addition to the lack of supply, the number of bitcoins leaving the stock exchanges has experienced a huge increase in abandoning exchanges.
The Glassnode platform revealed that 96,200 bitcoins leave the exchange every month, and the volume of bitcoin outflows continues to grow.
This can now be compared to the liquidity crisis in March 2020, followed by similar outflows of BTC from cryptocurrency exchanges on a huge scale. Asset supply is more limited than ever, and this milestone shows how bitcoin shortages have spurred asset growth.
The shortage remains central to the value of bitcoin and has fueled a bullish outlook among institutional investors and traders worldwide. Bitcoin owners add a significant amount of BTC to their funds. The influx of demand has spurred an increase in demand among investors.
The recent bitcoin withdrawal can be interpreted as healthy for the uptrend of assets.
-
Support
-
Platform
-
Spread
-
Trading Instrument

